


Maddie Landis
-
Posts
263 -
Joined
3 Followers


Maddie Landis's Achievements


-
 Maddie Landis reacted to a post in a topic:
Oops!... They Did It Again
Maddie Landis reacted to a post in a topic:
Oops!... They Did It Again
-
 Maddie Landis reacted to a post in a topic:
Talk Sox Podcast Questions - 10/4/26
Maddie Landis reacted to a post in a topic:
Talk Sox Podcast Questions - 10/4/26
-
Maddie Landis reacted to a post in a topic:
Don't Schlitt the Bed
-
Maddie Landis reacted to a post in a topic:
Don't Schlitt the Bed
-
Maddie Landis reacted to a post in a topic:
Talk Sox Podcast Questions - 10/4/26
-
Good morning! We’re recording our weekly Talk Sox Podcast on Sunday. Drop your questions below for @Alex Mayes and me. The cut-off is at 1:00 pm MDT on the 4th.
-
Cam Schlittler’s four-seamer averages 98 mph, almost four miles per hour faster than your typical right-handed pitcher. His 12-6 curveball has maxed out at 90.2 mph this year. In other words, the 6’6” Walpole native throws the ball ridiculously hard. Most analysts will tell you that his large frame gives him a biomechanics advantage to touch triple-digit velocity. I’m convinced some of it is fueled by his perpetual RBF. Schlittler isn’t the only high-octane Yankees pitcher the Boston Red Sox are going to see in the Wild Card Round. For instance, David Bednar anchors New York’s bullpen with a rising four-seamer (18” IVB) that averages 96.1 mph. So, it's probably pertinent to ask: How has the team fared against velocity this season? Mickey Gasper and Eli White feasted on hard pitches this year, posting OPS marks of 1.241 and .971, respectively, against premium velocity. Unfortunately, both players will miss the postseason. Gasper suffered from a right biceps strain, and White tore a ligament in his right foot on the center field garage door at Fenway. Jahmai Jones, who isn’t on the injured list, has handled 95+ just as well with a .977 OPS. Surprisingly, Roman Anthony .373 OPS ranks last among Red Sox batters. This is a significant drop from his .820 last year. Then there’s the weather. Over the Wild Card Series, the Bronx is expected to see a temperature range between 59 degrees and 67 degrees in the evening. As we get further into the week, the temperature starts creeping up. Tuesday night is expected to be the coldest game. If the series extends to Game 3, Thursday night’s game will be the warmest. Image courtesy of the National Weather Service There’s a ton of existing research on how weather impacts baseball and I’m not going to get into the weeds of humidity/temperature affecting pitch movement here. Instead, I want to look at something simpler: the Red Sox’s record across different temperature groups. During the Angels series earlier this month, I theorized that the team played worse in colder temperatures. I had forgotten about it until the Guardians series last week, so I pulled the data. I grouped every game this season by first-pitch temperature: Cold (59°F and below), Mild (60 to 74°F), and Warm (75°F and up). Temperature Bucket G W L Win% Run Diff RS RA Avg Temp Cold (59°F and below) 28 14 14 .500 +25 4.11 3.21 52.3°F Mild (60-74°F) 55 21 34 .382 -57 3.38 4.42 69.0°F Warm (75+°F) 79 52 27 .658 +110 4.91 3.52 81.5°F The Red Sox’s record didn’t support my theory. The “Cold” bucket consisted of 28 games, the fewest of the three and they played .500 ball with a +25 run differential in those games. Unsurprisingly, the team posted a .658 winning percentage and a +110 run differential in the “Warm” bucket, thanks in large part to the team’s historic 30-5 stretch in the middle of the summer. The “Mild” bucket contained the worst results: a .382 winning percentage and a negative run differential of -57. Back to the forecast, two of three games in the Wild Card Series land squarely in the “Mild” range, where they went 21-34. If the Red Sox want to advance to the division series, they need to win in the weather that’s plagued them all year. The Red Sox enter the first round of the playoffs as underdogs with velocity and weather working against them. They’ll face Schlittler’s triple-threat fastball mix tonight, sans Gasper and White. Fortunately, Schlittler is just one pitcher. As @Alex Mayes and I talked about on this week's Talk Sox podcast episode, once they get past Schlittler, Max Fried and a washed-up Gerrit Cole aren’t nearly as imposing. Anything can happen in the playoffs, and the Red Sox have thrived on chaos all season. body { background: #fff; color: #111; font-family: Arial, sans-serif; padding: 24px; } View full article
-
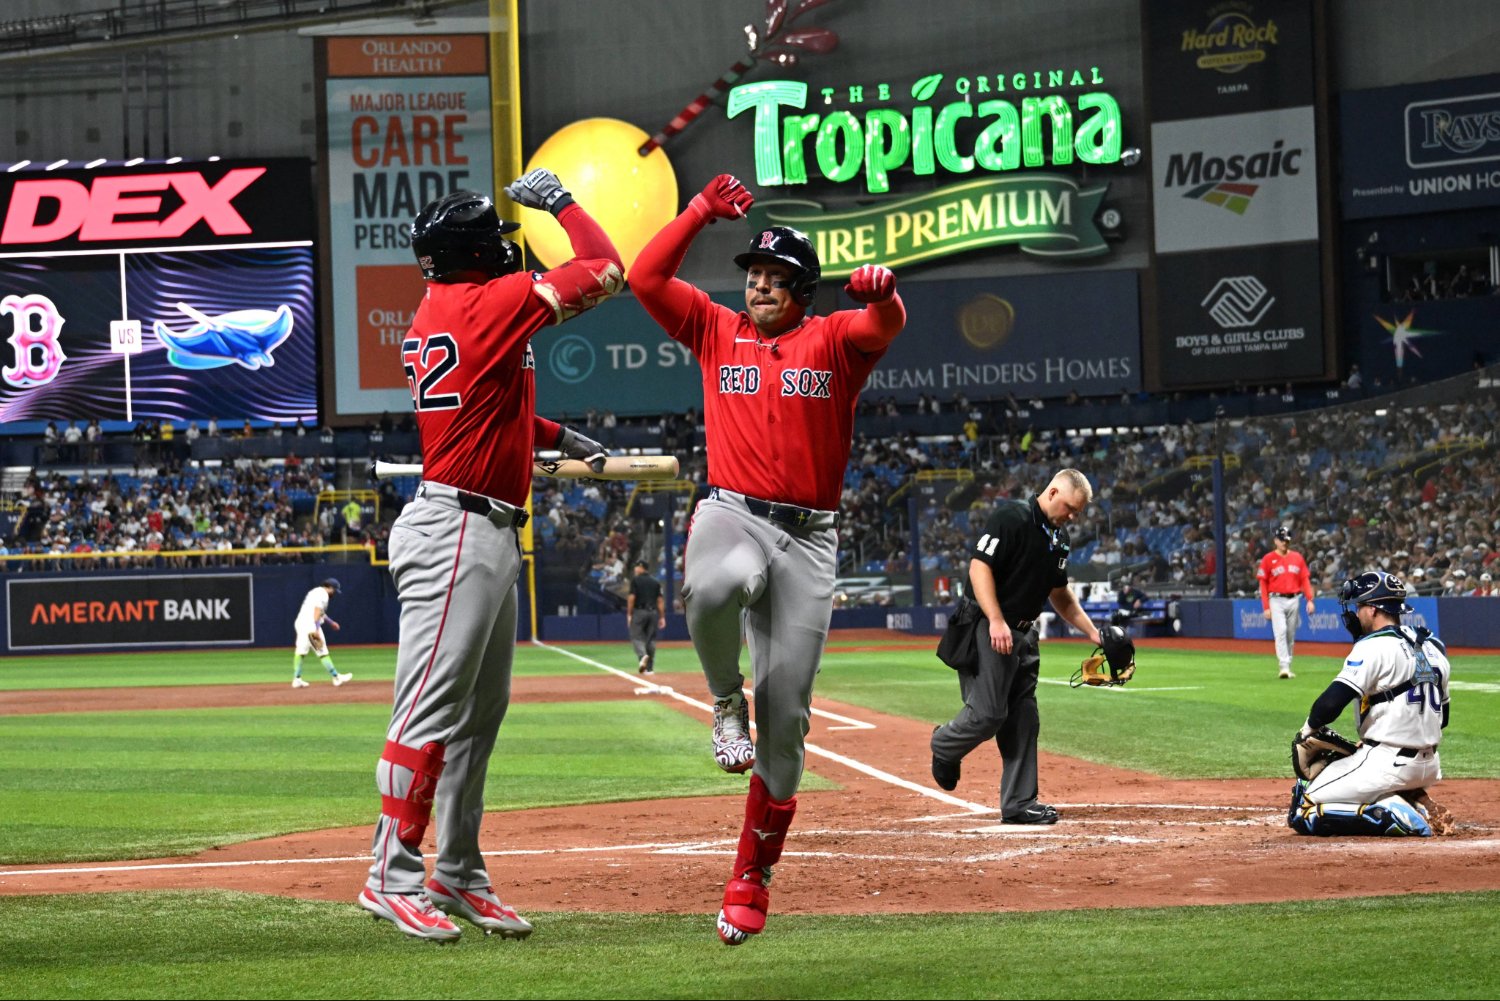 Cam Schlittler’s four-seamer averages 98 mph, almost four miles per hour faster than your typical right-handed pitcher. His 12-6 curveball has maxed out at 90.2 mph this year. In other words, the 6’6” Walpole native throws the ball ridiculously hard. Most analysts will tell you that his large frame gives him a biomechanics advantage to touch triple-digit velocity. I’m convinced some of it is fueled by his perpetual RBF. Schlittler isn’t the only high-octane Yankees pitcher the Boston Red Sox are going to see in the Wild Card Round. For instance, David Bednar anchors New York’s bullpen with a rising four-seamer (18” IVB) that averages 96.1 mph. So, it's probably pertinent to ask: How has the team fared against velocity this season? Mickey Gasper and Eli White feasted on hard pitches this year, posting OPS marks of 1.241 and .971, respectively, against premium velocity. Unfortunately, both players will miss the postseason. Gasper suffered from a right biceps strain, and White tore a ligament in his right foot on the center field garage door at Fenway. Jahmai Jones, who isn’t on the injured list, has handled 95+ just as well with a .977 OPS. Surprisingly, Roman Anthony .373 OPS ranks last among Red Sox batters. This is a significant drop from his .820 last year. Then there’s the weather. Over the Wild Card Series, the Bronx is expected to see a temperature range between 59 degrees and 67 degrees in the evening. As we get further into the week, the temperature starts creeping up. Tuesday night is expected to be the coldest game. If the series extends to Game 3, Thursday night’s game will be the warmest. Image courtesy of the National Weather Service There’s a ton of existing research on how weather impacts baseball and I’m not going to get into the weeds of humidity/temperature affecting pitch movement here. Instead, I want to look at something simpler: the Red Sox’s record across different temperature groups. During the Angels series earlier this month, I theorized that the team played worse in colder temperatures. I had forgotten about it until the Guardians series last week, so I pulled the data. I grouped every game this season by first-pitch temperature: Cold (59°F and below), Mild (60 to 74°F), and Warm (75°F and up). Temperature Bucket G W L Win% Run Diff RS RA Avg Temp Cold (59°F and below) 28 14 14 .500 +25 4.11 3.21 52.3°F Mild (60-74°F) 55 21 34 .382 -57 3.38 4.42 69.0°F Warm (75+°F) 79 52 27 .658 +110 4.91 3.52 81.5°F The Red Sox’s record didn’t support my theory. The “Cold” bucket consisted of 28 games, the fewest of the three and they played .500 ball with a +25 run differential in those games. Unsurprisingly, the team posted a .658 winning percentage and a +110 run differential in the “Warm” bucket, thanks in large part to the team’s historic 30-5 stretch in the middle of the summer. The “Mild” bucket contained the worst results: a .382 winning percentage and a negative run differential of -57. Back to the forecast, two of three games in the Wild Card Series land squarely in the “Mild” range, where they went 21-34. If the Red Sox want to advance to the division series, they need to win in the weather that’s plagued them all year. The Red Sox enter the first round of the playoffs as underdogs with velocity and weather working against them. They’ll face Schlittler’s triple-threat fastball mix tonight, sans Gasper and White. Fortunately, Schlittler is just one pitcher. As @Alex Mayes and I talked about on this week's Talk Sox podcast episode, once they get past Schlittler, Max Fried and a washed-up Gerrit Cole aren’t nearly as imposing. Anything can happen in the playoffs, and the Red Sox have thrived on chaos all season. body { background: #fff; color: #111; font-family: Arial, sans-serif; padding: 24px; }
 -
Maddie Landis reacted to a post in a topic:
Don't Schlitt the Bed
-
Good morning! We’re recording our final regular season episode of the Talk Sox Podcast on Sunday. Drop your questions below for @Alex Mayes and me. The cut-off is at 2:00 pm CST on the 26th.
-
On Wednesday night, Jarren Duran stole second in the bottom of the eighth, marking his 20th stolen base of the season and his second time joining the elite 20 home run, 20 stolen bases club. [He hit his 20th home run on September 7.] But... Jarren Duran? Elite club in 2026? Something isn't right here. A 20-20 season is a historic milestone. You’d expect a player who gets there to be a solid hitter. The kind of guy who instills fear in pitchers, not some dude whose kryptonite is an elevated fastball. Through 147 games this season, Duran has mustered a measly .207/.265/.364 slash line with a 27.5% strikeout rate, 6.5% walk rate, a 69 wRC+, and 0.5 fWAR. Red Sox fans are well aware of Duran’s nosedive since his previous 20/20 season in 2024, but how bad is this one compared to every other 20/20 season in baseball’s live-ball era? Let’s take a look. Where Jarren Duran's 20-20 Season Ranks All-Time Through September 25, 2026, 524 baseball players have achieved 20/20 seasons. The power/speed combo is becoming less rare in the modern game; 2025 saw a record total of 24 players who achieved 20/20 seasons. Duran was the 16th player to join the 20/20 club this year (Carson Benge has since joined him). There’s still a weekend of baseball to be played before the postseason is underway, and Trea Turner (19 HRs, 21 SBs) and Jazz Chisholm Jr. (19 HRs, 41 SBs) are on the verge of breaking into the club. [Back in February, Chisholm Jr. boldly proclaimed that he would be the second member of the elusive 50/50 club. There's always next year.] Since 1920, players in the 20/20 club recorded an average .284/.362/.505 slash line. Turkey Stearns, one of the most prolific hitters in the Negro leagues, posted the highest average (.383) and OPS (1.174) in 1926. Barry Bonds’ 1996 season saw the highest OBP (.461). Larry Walker’s 1997 NL MVP campaign marked the highest slugging percentage (.720). On the extreme end of homers, Ken Griffey Jr. clubbed 56 in 1998. Those guys sit in the upper echelons of the 20/20 club. Now, we pivot to the basement. Last year, Oneil Cruz batted to a tune of .200, so Duran’s .207 mark is safe, but his .265 on-base percentage, .364 slugging percentage, and .629 on-base plus slugging percentage are ranked dead last. Previously, Yankees shortstop Anthony Volpe’s .666 OPS was the lowest in a 20/20 season. Duran undercut Volpe by 37 points of OPS, which is a sizable gap for a record low. Like I said earlier, the season isn't quite over yet. With Ceddanne Rafaela dealing with lingering hamstring tightness, Duran will likely see more playing time as the Red Sox gear up for the postseason as the team rests Rafaela ahead of the AL Wild Card series. At the very least, Duran's 20/20 season is a unique selling point if chief baseball officer Craig Breslow attempts to trade him in the offseason. Also, in Duran's defense, he has been up on the upswing with an .841 OPS in his last seven games. Watching him score from second on Andruw Monasterio's single on Tuesday night was absolutely exhilarating. It was the Red Sox's lone run of the game, and it reminded us of the dynamic player that Duran can be -- when he actually gets on base. It's not exactly the kind of history we wanted to celebrate in 2026, but by all accounts, it looks like we’ve just witnessed the worst 20-20 season in the live-ball era. View full article
-
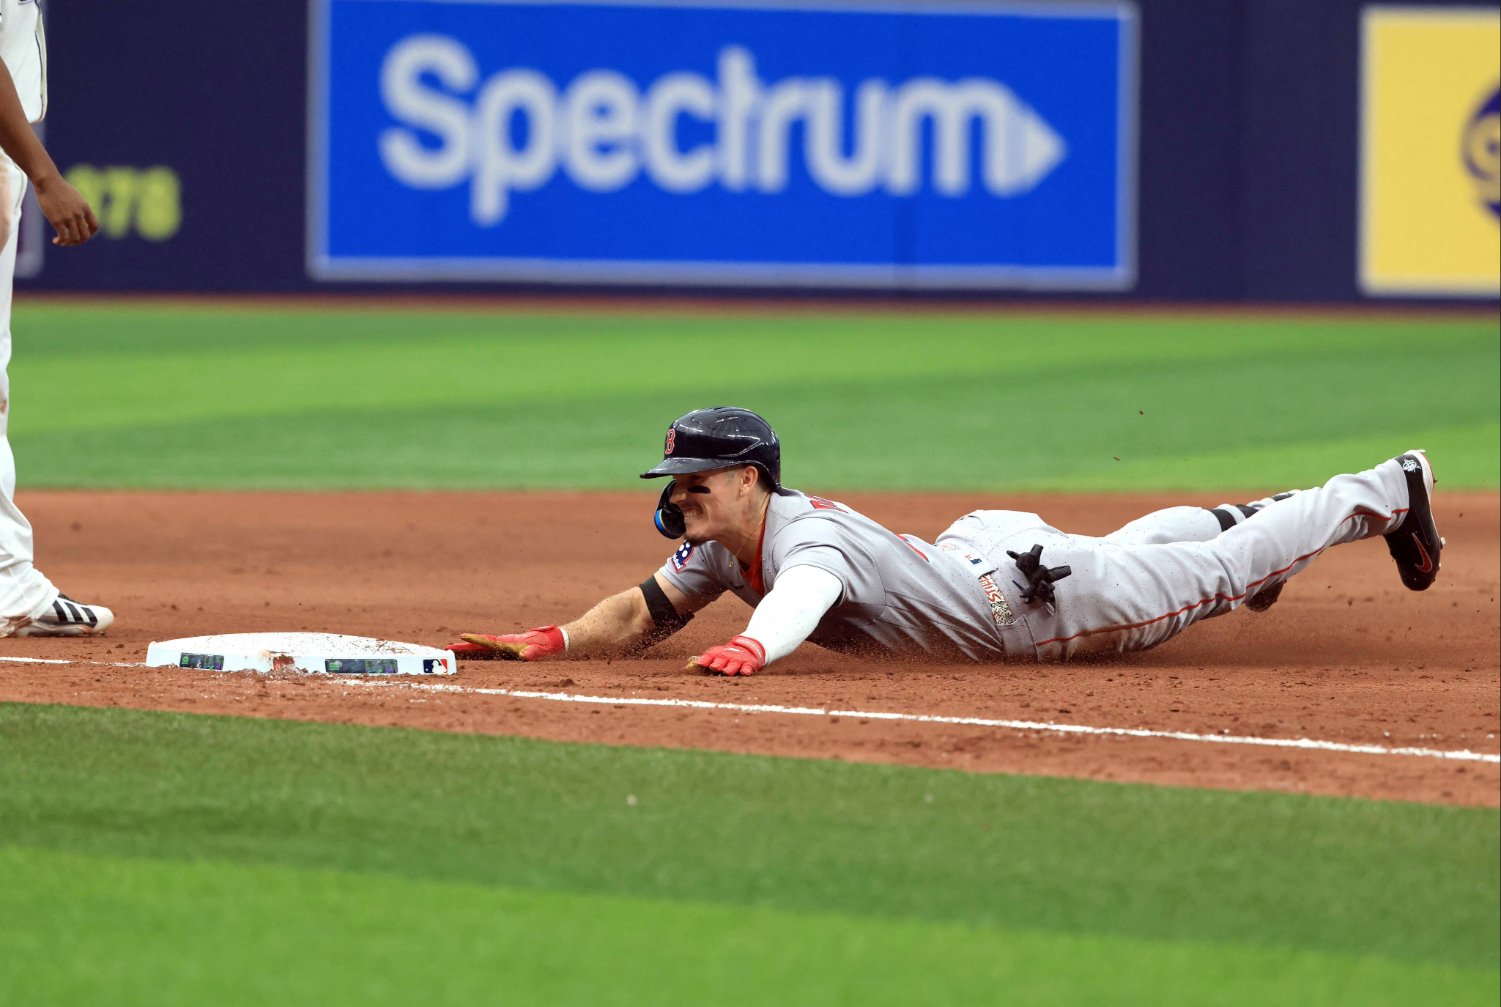 On Wednesday night, Jarren Duran stole second in the bottom of the eighth, marking his 20th stolen base of the season and his second time joining the elite 20 home run, 20 stolen bases club. [He hit his 20th home run on September 7.] But... Jarren Duran? Elite club in 2026? Something isn't right here. A 20-20 season is a historic milestone. You’d expect a player who gets there to be a solid hitter. The kind of guy who instills fear in pitchers, not some dude whose kryptonite is an elevated fastball. Through 147 games this season, Duran has mustered a measly .207/.265/.364 slash line with a 27.5% strikeout rate, 6.5% walk rate, a 69 wRC+, and 0.5 fWAR. Red Sox fans are well aware of Duran’s nosedive since his previous 20/20 season in 2024, but how bad is this one compared to every other 20/20 season in baseball’s live-ball era? Let’s take a look. Where Jarren Duran's 20-20 Season Ranks All-Time Through September 25, 2026, 524 baseball players have achieved 20/20 seasons. The power/speed combo is becoming less rare in the modern game; 2025 saw a record total of 24 players who achieved 20/20 seasons. Duran was the 16th player to join the 20/20 club this year (Carson Benge has since joined him). There’s still a weekend of baseball to be played before the postseason is underway, and Trea Turner (19 HRs, 21 SBs) and Jazz Chisholm Jr. (19 HRs, 41 SBs) are on the verge of breaking into the club. [Back in February, Chisholm Jr. boldly proclaimed that he would be the second member of the elusive 50/50 club. There's always next year.] Since 1920, players in the 20/20 club recorded an average .284/.362/.505 slash line. Turkey Stearns, one of the most prolific hitters in the Negro leagues, posted the highest average (.383) and OPS (1.174) in 1926. Barry Bonds’ 1996 season saw the highest OBP (.461). Larry Walker’s 1997 NL MVP campaign marked the highest slugging percentage (.720). On the extreme end of homers, Ken Griffey Jr. clubbed 56 in 1998. Those guys sit in the upper echelons of the 20/20 club. Now, we pivot to the basement. Last year, Oneil Cruz batted to a tune of .200, so Duran’s .207 mark is safe, but his .265 on-base percentage, .364 slugging percentage, and .629 on-base plus slugging percentage are ranked dead last. Previously, Yankees shortstop Anthony Volpe’s .666 OPS was the lowest in a 20/20 season. Duran undercut Volpe by 37 points of OPS, which is a sizable gap for a record low. Like I said earlier, the season isn't quite over yet. With Ceddanne Rafaela dealing with lingering hamstring tightness, Duran will likely see more playing time as the Red Sox gear up for the postseason as the team rests Rafaela ahead of the AL Wild Card series. At the very least, Duran's 20/20 season is a unique selling point if chief baseball officer Craig Breslow attempts to trade him in the offseason. Also, in Duran's defense, he has been up on the upswing with an .841 OPS in his last seven games. Watching him score from second on Andruw Monasterio's single on Tuesday night was absolutely exhilarating. It was the Red Sox's lone run of the game, and it reminded us of the dynamic player that Duran can be -- when he actually gets on base. It's not exactly the kind of history we wanted to celebrate in 2026, but by all accounts, it looks like we’ve just witnessed the worst 20-20 season in the live-ball era.
 -
Maddie Landis reacted to a post in a topic:
9/20 Talk Sox Podcast Questions
-
Good morning! We’re recording the next episode of the Talk Sox Podcast on Sunday. Drop your questions below for @Alex Mayes and me. The cut-off is at 2:00 pm CST on the 20th.
-
That double play last night was insane!
-
Maddie Landis reacted to a post in a topic:
Emulating Nico Hoerner May Be Nick Sogard's Best Path Forward
-
After whiffing on Alex Bregman in free agency, Nico Hoerner was floated as a potential fit for the Boston Red Sox. It turns out they didn’t need Hoerner. Boston has their very own contact-oriented, squared-jawed second baseman with a nice flow. On the surface, Nick Sogard and Nico Hoerner look like very similar hitters. Sogard isn’t a Statcast darling, nor is Hoerner. They don’t hit the ball hard. Their bat speeds grade in the bottom tenth of the league. They won’t turn any heads with their 86.8 and 86 mph exit velocities, nor do they barrel the ball often. Their greatest strengths lie in their plate discipline and contact efficiency. Let’s start with the most obvious difference: Hoerner is a faster player. His 77th percentile sprint speed helps boost his expected batting average to the 99th percentile. He’s also an elite defender and has won two Gold Gloves manning the keystone. It’s a bit of a stretch to say that Sogard will win a Gold Glove sometime during his career. Nonetheless, he’s a serviceable defender. In previous seasons, he filled in wherever infield help was needed, but he’s found a semi-permanent home at second this year, posting a -1 DRS, 1 OAA, and 2 FRV across 260 innings. Two years ago, FanGraphs’ Ben Clemens conducted a deep dive on squared-up rate versus launch angle. Following his methodology, I created a chart comparing Nick Sogard and Nico Hoerner’s contact quality across every ball they’ve hit into play over the past two seasons. Hoerner squares up even when he’s hitting the ball into the dirt. He squares up 75% to 78% of balls hit at negative launch angles, which is nearly the same rate as his line drives (10-25 degrees). It’s rare to see a hitter who maintains their quality of contact that far below the line drive band, but Hoerner is a contact artist with elite bat control. Sogard’s squared-up rate falls roughly 16 percentage points, from 82.5% at 12 degrees to 66.7% at -14 degrees. Hoerner drops five points over the same stretch. In the sweet spot range (8 to 32 degrees), they’re squaring up at nearly identical rates. Their gap never exceeds 3.5 points, and the lead oscillates three times across the range. Hoerner peaks in the 18-22 degree bucket, averaging an 80.6% squared-up rate. Sogard's peak sits lower and wider, squaring up between 80% and 83% of the time from -2 to 14 degrees. Hoerner’s squared-up rate collapses above 38 degrees, whereas Sogard's plateaus around 60%. This is the exact opposite of their grounder gap. Sogard and Hoerner’s swing path tilt numbers are nearly identical at 33 degrees and 32 degrees, respectively. Their attack angles have a nine-degree gap, a byproduct of where they’re pitched. Player Swings Bat Speed Attack Angle Swing Length Tilt Ideal AA% EV LA Nick Sogard 304 69.2 14° 7.1 ft 33° 50.0% 87.1 17° Nico Hoerner 946 68.3 5° 7.3 ft 32° 45.6% 87.0 12° A steeper attack means the bat is traveling upward upon contact. It matches low pitches better, since the ball is descending into the bat path. It produces more lift on contact, resulting in higher launch angles and more fly balls and homers. A flatter attack angle covers the top of the zone better and yields more line drives and grounders. Generally speaking, we see contact hitters utilize flatter attack angles. Statcast divides the strike zone into four areas: the Heart, Shadow, Chase, and Waste Zone. Hoerner has played in more games than Sogard this year, so raw pitch counts aren’t an exact apples-to-apples comparison. Normalized via heat-maps, Hoerner’s seen a higher number of pitches in the Heart. Sogard bats left most of the time. As a lefty, pitchers attack him in the bottom shadow zone (Attack Zone 18). As a righty, Sogard sees more pitches in the heart of the plate (Attack Zones 2, 5, and 8). What happens when they connect with the ball? Hoerner hits more grounders, but as previously mentioned, he squares those up, so they’re not weak dribblers. His speed also bails him out of grounders that would be outs for most hitters. Player GB% FB% LD% PU% Pull Air% Nick Sogard 38.9% 21.5% 29.5% 10.1% 24.2% Nico Hoerner 43.5% 20.8% 28.2% 7.6% 13.0% Sogard doesn’t have elite speed to beat out grounders, but that isn’t a huge factor in his batted ball profile. Pulling the ball in the air reaps benefits for hitters. Over a third of them leave the yard. Sogard’s 24.2% pull-air rate is nearly double Hoerner’s. He’s seen that number jump across both sides of the plate. Last year, he recorded a 19.6% pull-air rate batting left, whereas this year it’s up to 23.5%. On the right side, it jumped from 23.1% to 26.7%. Fenway rewards switch hitters. Batting left, a line drive can sneak into the stands for a ground-rule double. Batting right, a pulled ball in the air connects with the Green Monster. Nick Sogard's Statcast Profile on Pulled Balls Season BBE EV LA Barrel% Hard-Hit% ISO BA xBA SLG xSLG wOBA xwOBA 2025 32 90.2 8 9.4% 46.9% .125 .344 .341 .469 .589 .350 .394 2026 66 88.6 9 7.6% 42.4% .288 .394 .363 .682 .557 .459 .394 Playing in a career-high 52 games in the majors this year, Sogard has sharpened his plate discipline. He’s cut his strikeout rate from 23.1% in 2025 to 19.9% in 2026, while bolstering his walk rate to 12.7% from 4.8%. He’s also not feasting on meatballs from mediocre guys. He’s hit home runs off Max Fried and Yennier Cano, two star pitchers. Looking at Hoerner and Sogard’s spray charts, you see the difference in their batted ball profiles. Hoerner’s is a wall of singles piled up in the infield and shallow outfield, which is exactly where you’d expect a guy with a five-degree attack angle to hit the ball. His home runs cluster down the left field line. Sogard’s damage varies based on his handedness. Nico Hoerner is a veteran second baseman. His profile is what a flat swing and elite bat control produce over six seasons. Heading into his age-30 season in 2027, it’s safe to say he’s hit his ceiling. He probably won’t ever hit more than 15 home runs in a season, which is fine, since the Cubs have plenty of other power hitters in their lineup to drive him home. Unlike Hoerner, Sogard’s still trying to figure out who he is as a hitter. Does he try to tap into his power, or does he stick to a contact-oriented approach? The Red Sox already have the latter in Caleb Durbin. Going forward, Sogard’s future looks murky. The team is loaded with solid, but not elite infielders. Boston traded for Curtis Mead, who fractured his left wrist in his debut. Mead has been on the 10-day IL and hasn’t swung yet. We probably won’t see him take the field for Boston again this year. Mead had a breakout first half with a surge in power, though his defense isn’t on par with Sogard’s. It’ll be interesting to watch the battle for second base whenever spring training occurs next year. Sogard has only appeared in 113 games across three seasons in Boston. This year, he’s blossomed into an X-factor for the team, and it’s safe to say he’s earned his spot on the postseason roster. He provides defensive versatility and elite plate discipline on both sides of the plate. His pull-air rate plays well in Fenway Park, and he has a knack for clutch hits. The Red Sox play better when Sogard is in the lineup, and his presence won’t be overlooked in October. View full article
-
Emulating Nico Hoerner May Be Nick Sogard's Best Path Forward
Maddie Landis posted an article in Red Sox
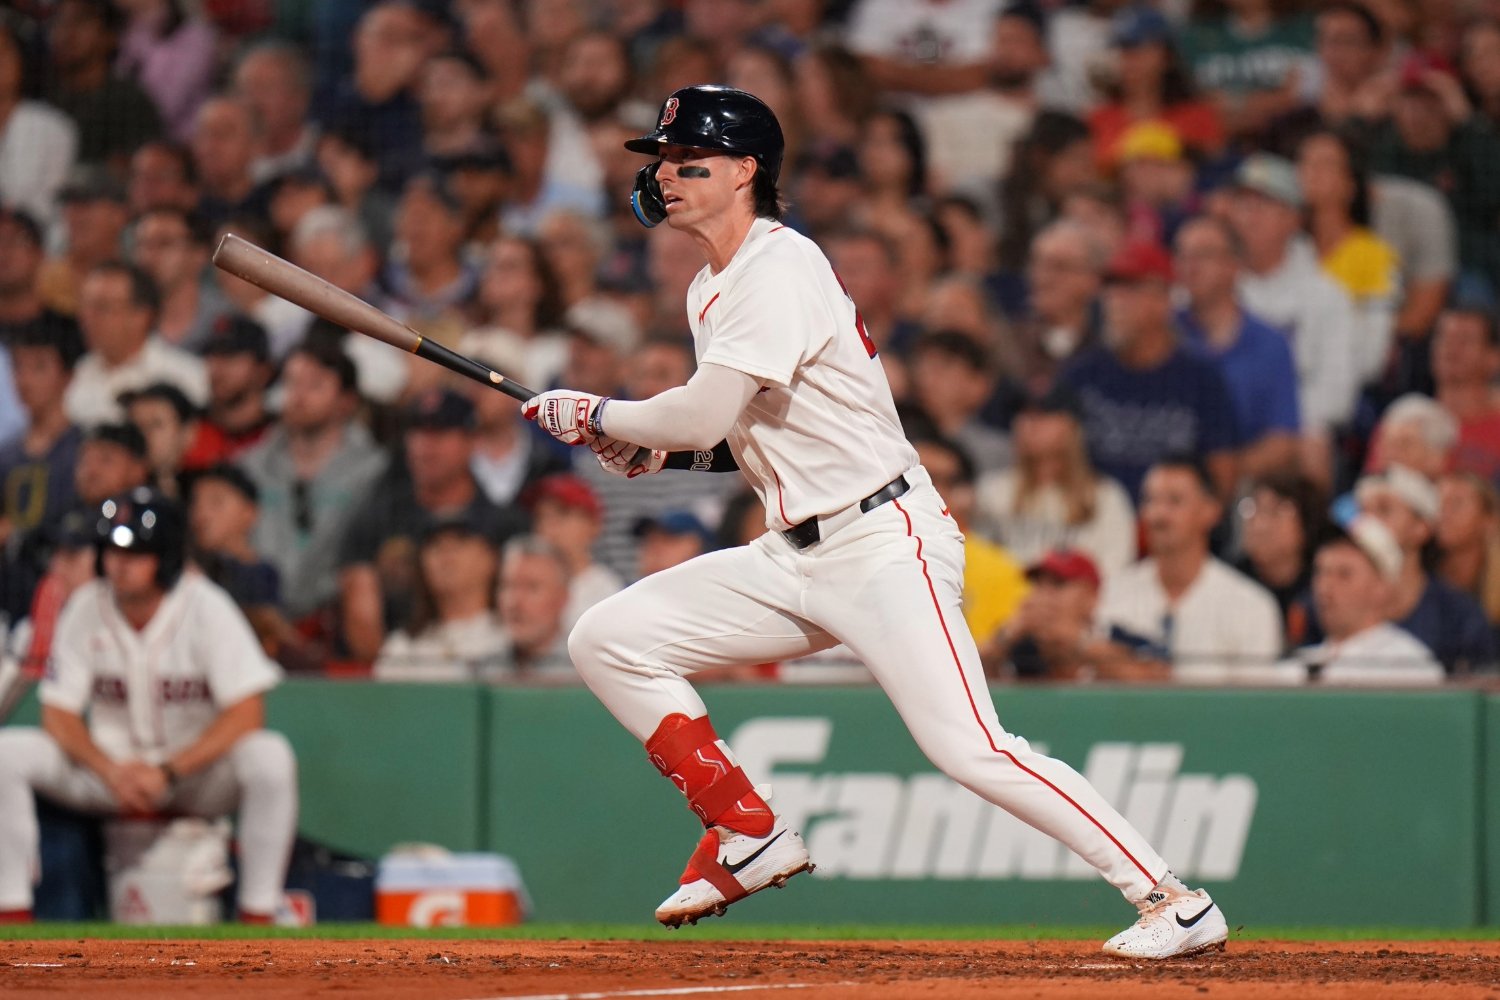 After whiffing on Alex Bregman in free agency, Nico Hoerner was floated as a potential fit for the Boston Red Sox. It turns out they didn’t need Hoerner. Boston has their very own contact-oriented, squared-jawed second baseman with a nice flow. On the surface, Nick Sogard and Nico Hoerner look like very similar hitters. Sogard isn’t a Statcast darling, nor is Hoerner. They don’t hit the ball hard. Their bat speeds grade in the bottom tenth of the league. They won’t turn any heads with their 86.8 and 86 mph exit velocities, nor do they barrel the ball often. Their greatest strengths lie in their plate discipline and contact efficiency. Let’s start with the most obvious difference: Hoerner is a faster player. His 77th percentile sprint speed helps boost his expected batting average to the 99th percentile. He’s also an elite defender and has won two Gold Gloves manning the keystone. It’s a bit of a stretch to say that Sogard will win a Gold Glove sometime during his career. Nonetheless, he’s a serviceable defender. In previous seasons, he filled in wherever infield help was needed, but he’s found a semi-permanent home at second this year, posting a -1 DRS, 1 OAA, and 2 FRV across 260 innings. Two years ago, FanGraphs’ Ben Clemens conducted a deep dive on squared-up rate versus launch angle. Following his methodology, I created a chart comparing Nick Sogard and Nico Hoerner’s contact quality across every ball they’ve hit into play over the past two seasons. Hoerner squares up even when he’s hitting the ball into the dirt. He squares up 75% to 78% of balls hit at negative launch angles, which is nearly the same rate as his line drives (10-25 degrees). It’s rare to see a hitter who maintains their quality of contact that far below the line drive band, but Hoerner is a contact artist with elite bat control. Sogard’s squared-up rate falls roughly 16 percentage points, from 82.5% at 12 degrees to 66.7% at -14 degrees. Hoerner drops five points over the same stretch. In the sweet spot range (8 to 32 degrees), they’re squaring up at nearly identical rates. Their gap never exceeds 3.5 points, and the lead oscillates three times across the range. Hoerner peaks in the 18-22 degree bucket, averaging an 80.6% squared-up rate. Sogard's peak sits lower and wider, squaring up between 80% and 83% of the time from -2 to 14 degrees. Hoerner’s squared-up rate collapses above 38 degrees, whereas Sogard's plateaus around 60%. This is the exact opposite of their grounder gap. Sogard and Hoerner’s swing path tilt numbers are nearly identical at 33 degrees and 32 degrees, respectively. Their attack angles have a nine-degree gap, a byproduct of where they’re pitched. Player Swings Bat Speed Attack Angle Swing Length Tilt Ideal AA% EV LA Nick Sogard 304 69.2 14° 7.1 ft 33° 50.0% 87.1 17° Nico Hoerner 946 68.3 5° 7.3 ft 32° 45.6% 87.0 12° A steeper attack means the bat is traveling upward upon contact. It matches low pitches better, since the ball is descending into the bat path. It produces more lift on contact, resulting in higher launch angles and more fly balls and homers. A flatter attack angle covers the top of the zone better and yields more line drives and grounders. Generally speaking, we see contact hitters utilize flatter attack angles. Statcast divides the strike zone into four areas: the Heart, Shadow, Chase, and Waste Zone. Hoerner has played in more games than Sogard this year, so raw pitch counts aren’t an exact apples-to-apples comparison. Normalized via heat-maps, Hoerner’s seen a higher number of pitches in the Heart. Sogard bats left most of the time. As a lefty, pitchers attack him in the bottom shadow zone (Attack Zone 18). As a righty, Sogard sees more pitches in the heart of the plate (Attack Zones 2, 5, and 8). What happens when they connect with the ball? Hoerner hits more grounders, but as previously mentioned, he squares those up, so they’re not weak dribblers. His speed also bails him out of grounders that would be outs for most hitters. Player GB% FB% LD% PU% Pull Air% Nick Sogard 38.9% 21.5% 29.5% 10.1% 24.2% Nico Hoerner 43.5% 20.8% 28.2% 7.6% 13.0% Sogard doesn’t have elite speed to beat out grounders, but that isn’t a huge factor in his batted ball profile. Pulling the ball in the air reaps benefits for hitters. Over a third of them leave the yard. Sogard’s 24.2% pull-air rate is nearly double Hoerner’s. He’s seen that number jump across both sides of the plate. Last year, he recorded a 19.6% pull-air rate batting left, whereas this year it’s up to 23.5%. On the right side, it jumped from 23.1% to 26.7%. Fenway rewards switch hitters. Batting left, a line drive can sneak into the stands for a ground-rule double. Batting right, a pulled ball in the air connects with the Green Monster. Nick Sogard's Statcast Profile on Pulled Balls Season BBE EV LA Barrel% Hard-Hit% ISO BA xBA SLG xSLG wOBA xwOBA 2025 32 90.2 8 9.4% 46.9% .125 .344 .341 .469 .589 .350 .394 2026 66 88.6 9 7.6% 42.4% .288 .394 .363 .682 .557 .459 .394 Playing in a career-high 52 games in the majors this year, Sogard has sharpened his plate discipline. He’s cut his strikeout rate from 23.1% in 2025 to 19.9% in 2026, while bolstering his walk rate to 12.7% from 4.8%. He’s also not feasting on meatballs from mediocre guys. He’s hit home runs off Max Fried and Yennier Cano, two star pitchers. Looking at Hoerner and Sogard’s spray charts, you see the difference in their batted ball profiles. Hoerner’s is a wall of singles piled up in the infield and shallow outfield, which is exactly where you’d expect a guy with a five-degree attack angle to hit the ball. His home runs cluster down the left field line. Sogard’s damage varies based on his handedness. Nico Hoerner is a veteran second baseman. His profile is what a flat swing and elite bat control produce over six seasons. Heading into his age-30 season in 2027, it’s safe to say he’s hit his ceiling. He probably won’t ever hit more than 15 home runs in a season, which is fine, since the Cubs have plenty of other power hitters in their lineup to drive him home. Unlike Hoerner, Sogard’s still trying to figure out who he is as a hitter. Does he try to tap into his power, or does he stick to a contact-oriented approach? The Red Sox already have the latter in Caleb Durbin. Going forward, Sogard’s future looks murky. The team is loaded with solid, but not elite infielders. Boston traded for Curtis Mead, who fractured his left wrist in his debut. Mead has been on the 10-day IL and hasn’t swung yet. We probably won’t see him take the field for Boston again this year. Mead had a breakout first half with a surge in power, though his defense isn’t on par with Sogard’s. It’ll be interesting to watch the battle for second base whenever spring training occurs next year. Sogard has only appeared in 113 games across three seasons in Boston. This year, he’s blossomed into an X-factor for the team, and it’s safe to say he’s earned his spot on the postseason roster. He provides defensive versatility and elite plate discipline on both sides of the plate. His pull-air rate plays well in Fenway Park, and he has a knack for clutch hits. The Red Sox play better when Sogard is in the lineup, and his presence won’t be overlooked in October.
 -
Maddie Landis reacted to a post in a topic:
Talk Sox Podcast Questions, 9/13
-
Maddie Landis reacted to a post in a topic:
Talk Sox Podcast Questions, 9/13
-
Good morning! We’re recording the next episode of the Talk Sox Podcast on Sunday. Drop your questions below for @Alex Mayes and me. The cut-off is at 2:00 pm CST on the 13th.
-
Talk Sox Podcast Episode Questions, Labor Day Weekend
Maddie Landis replied to Maddie Landis's topic in Boston Red Sox Talk
No worries. Best of luck to both children in their sports! I remember the cross-country days. :) -
Good morning! Drop your questions below for @Alex Mayes and me. We’ll answer them on the next Talk Sox podcast episode. The cutoff for questions is 2:00 pm CST on the 6th.
-
Hello! We’re recording the next episode of the Talk Sox Podcast on Sunday. Drop your questions below for both myself and @Alex Mayes. We’ll put the cutoff for questions at 2:00 pm CST on the 30th.
-
SoxDiehard reacted to a post in a topic:
Sogard, So Good
-
I vaguely remember hearing about the traveling secretary incident, though I was just eight years old at the time. Manny didn't directly apologize until 2014. Six years later! After learning this, I'd flip Damon/Manny
