

Yirsandy Rodríguez
-
Posts
25 -
Joined
-
Last visited
Yirsandy Rodríguez's Achievements
")


-
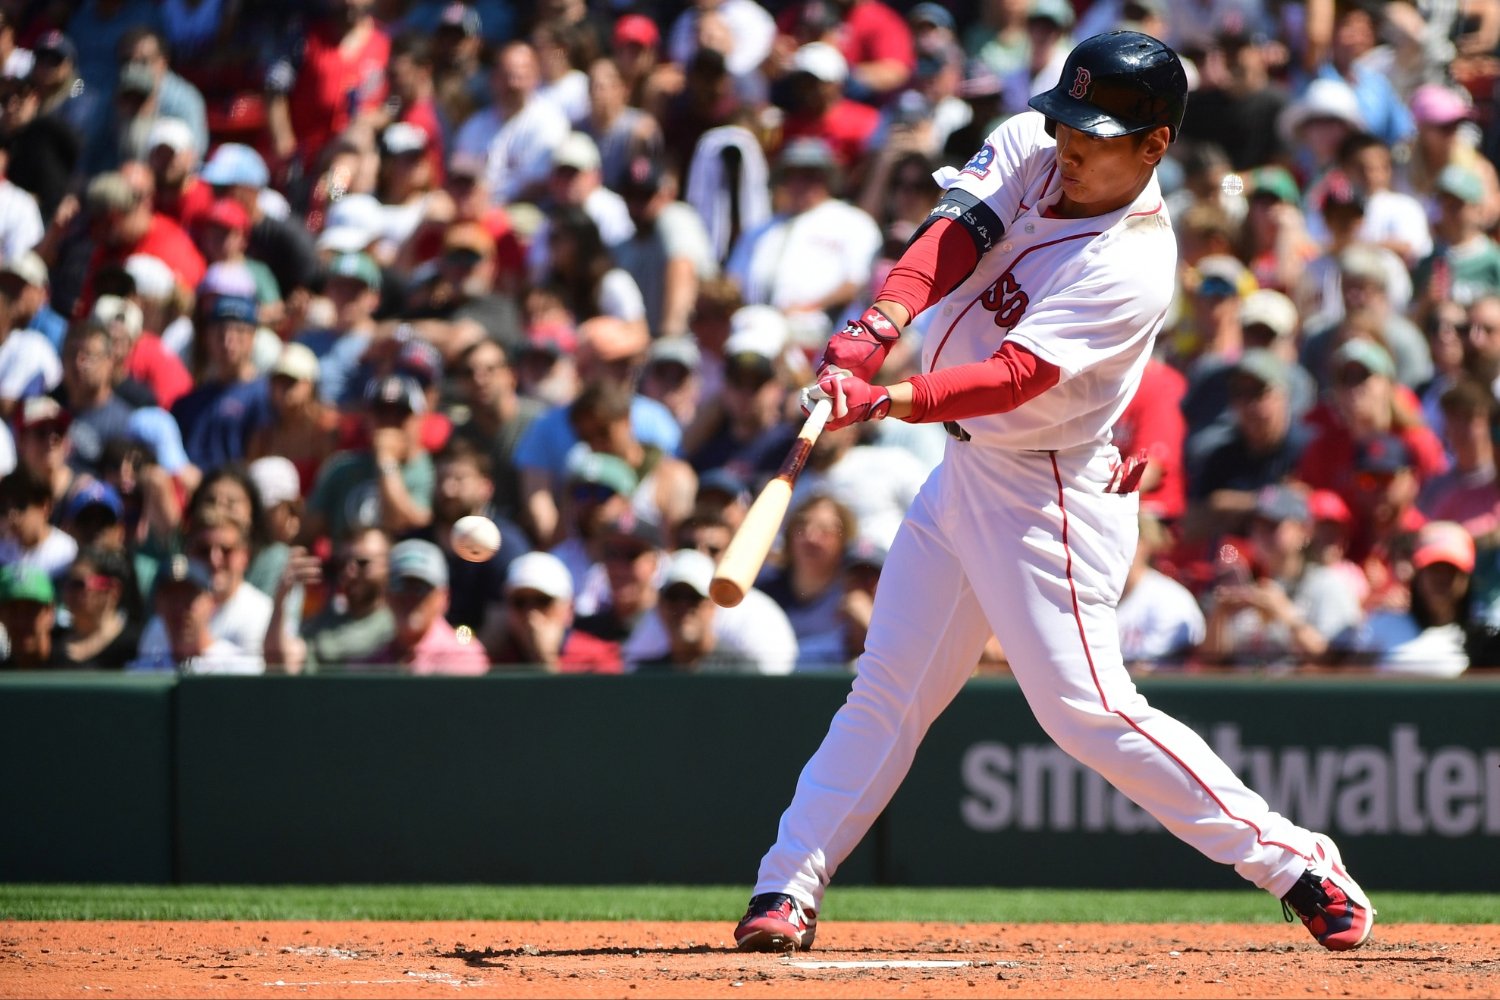
 Masataka Yoshida was not struggling in the way that usually concerns a contact hitter. He was still recognizing pitches, controlling the strike zone, and making contact against offerings that many hitters cannot handle. The problem was that pitchers were no longer paying the price when they made mistakes against him. During June, Yoshida turned one of his greatest strengths into a limitation. His ability to find the baseball remained intact, but too many of those batted-ball events produced trajectories that favored the defense. Opposing pitchers did not need to beat him with velocity, deception, or a perfectly sequenced attack. They could challenge him with four-seam fastballs, accept that he would put the ball in play, and trust that the result would be a manageable out. When a hitter built around contact goes through an offensive slump, the first question is usually whether something in the process has broken: Is he swinging and missing more? Chasing more pitches? Losing bat speed? But that did not describe what was happening with Yoshida. The difference was what happened after contact. To understand what's been going on under the hood, we'll look to where all slumps start: with fastballs. That pitch has always been one of the most important tests for Yoshida because it represents the opportunity to punish the type of mistake he is built to attack. If pitchers could throw fastballs in the zone and survive, they had found a simple solution against a hitter whose game depends on taking advantage of mistakes. During June, that approach worked. Against fastballs, Yoshida hit .222 with a .370 slugging percentage. Month AVG vs Fastballs SLG vs Fastballs xSLG Exit Velocity Launch Angle June .222 .370 .329 88.4 mph 0° July .333 .778 .594 91.0 mph 14° The change in July appears in one number that explains the transformation better than any batting average: launch angle. In June, Yoshida averaged 0 degrees against fastballs. His contact was producing a trajectory that turned good swings into predictable outcomes (i.e., grounders) for the defense. For a hitter whose advantage comes from consistently finding the baseball, that was the worst possible scenario: winning the battle against the pitch but losing the outcome of the at-bat. In July, that dynamic has started to change. Yoshida’s launch angle against fastballs has increased to 14 degrees, while his average exit velocity climbed from 88.4 mph to 91.0 mph. The difference may look small on a spreadsheet, but it completely changes how pitchers must evaluate their mistakes. The most interesting part of Yoshida’s adjustment is that it did not come from searching for a new offensive identity; his whiff rate against fastballs dropped from 17.6% in June to 15.2% in July. In other words, Yoshida did not start producing more damage because he started selling out for power. And, in turn, the power has actually returned on its own: His xSLG against fastballs jumped from .329 to .594. The recent results are eye-catching. In his first 26 plate appearances of July, Yoshida posted a .385 batting average, a .731 slugging percentage and a 217 wRC+. That production is not sustainable over a full season, and his .381 BABIP suggests some of that performance will naturally decline over time. But that is not what's important; the real question is whether Yoshida regained the ability that changes how pitchers can attack him. If so, the Red Sox have regained a key weapon in their lineup for the second half, just in time for a surge that has them right back in the thick of the playoff hunt. View full article
 -
 Masataka Yoshida was not struggling in the way that usually concerns a contact hitter. He was still recognizing pitches, controlling the strike zone, and making contact against offerings that many hitters cannot handle. The problem was that pitchers were no longer paying the price when they made mistakes against him. During June, Yoshida turned one of his greatest strengths into a limitation. His ability to find the baseball remained intact, but too many of those batted-ball events produced trajectories that favored the defense. Opposing pitchers did not need to beat him with velocity, deception, or a perfectly sequenced attack. They could challenge him with four-seam fastballs, accept that he would put the ball in play, and trust that the result would be a manageable out. When a hitter built around contact goes through an offensive slump, the first question is usually whether something in the process has broken: Is he swinging and missing more? Chasing more pitches? Losing bat speed? But that did not describe what was happening with Yoshida. The difference was what happened after contact. To understand what's been going on under the hood, we'll look to where all slumps start: with fastballs. That pitch has always been one of the most important tests for Yoshida because it represents the opportunity to punish the type of mistake he is built to attack. If pitchers could throw fastballs in the zone and survive, they had found a simple solution against a hitter whose game depends on taking advantage of mistakes. During June, that approach worked. Against fastballs, Yoshida hit .222 with a .370 slugging percentage. Month AVG vs Fastballs SLG vs Fastballs xSLG Exit Velocity Launch Angle June .222 .370 .329 88.4 mph 0° July .333 .778 .594 91.0 mph 14° The change in July appears in one number that explains the transformation better than any batting average: launch angle. In June, Yoshida averaged 0 degrees against fastballs. His contact was producing a trajectory that turned good swings into predictable outcomes (i.e., grounders) for the defense. For a hitter whose advantage comes from consistently finding the baseball, that was the worst possible scenario: winning the battle against the pitch but losing the outcome of the at-bat. In July, that dynamic has started to change. Yoshida’s launch angle against fastballs has increased to 14 degrees, while his average exit velocity climbed from 88.4 mph to 91.0 mph. The difference may look small on a spreadsheet, but it completely changes how pitchers must evaluate their mistakes. The most interesting part of Yoshida’s adjustment is that it did not come from searching for a new offensive identity; his whiff rate against fastballs dropped from 17.6% in June to 15.2% in July. In other words, Yoshida did not start producing more damage because he started selling out for power. And, in turn, the power has actually returned on its own: His xSLG against fastballs jumped from .329 to .594. The recent results are eye-catching. In his first 26 plate appearances of July, Yoshida posted a .385 batting average, a .731 slugging percentage and a 217 wRC+. That production is not sustainable over a full season, and his .381 BABIP suggests some of that performance will naturally decline over time. But that is not what's important; the real question is whether Yoshida regained the ability that changes how pitchers can attack him. If so, the Red Sox have regained a key weapon in their lineup for the second half, just in time for a surge that has them right back in the thick of the playoff hunt.
 -
Thanks! I appreciate that. Hopefully it's worth the second read. I wanted to explain why Bennett has been so effective, not just what the numbers say. I'd love to hear your thoughts after you've had that coffee.
-
 Yirsandy Rodríguez reacted to a post in a topic:
How Jake Bennett Is Succeeding Without A Dominant Pitch
Yirsandy Rodríguez reacted to a post in a topic:
How Jake Bennett Is Succeeding Without A Dominant Pitch
-
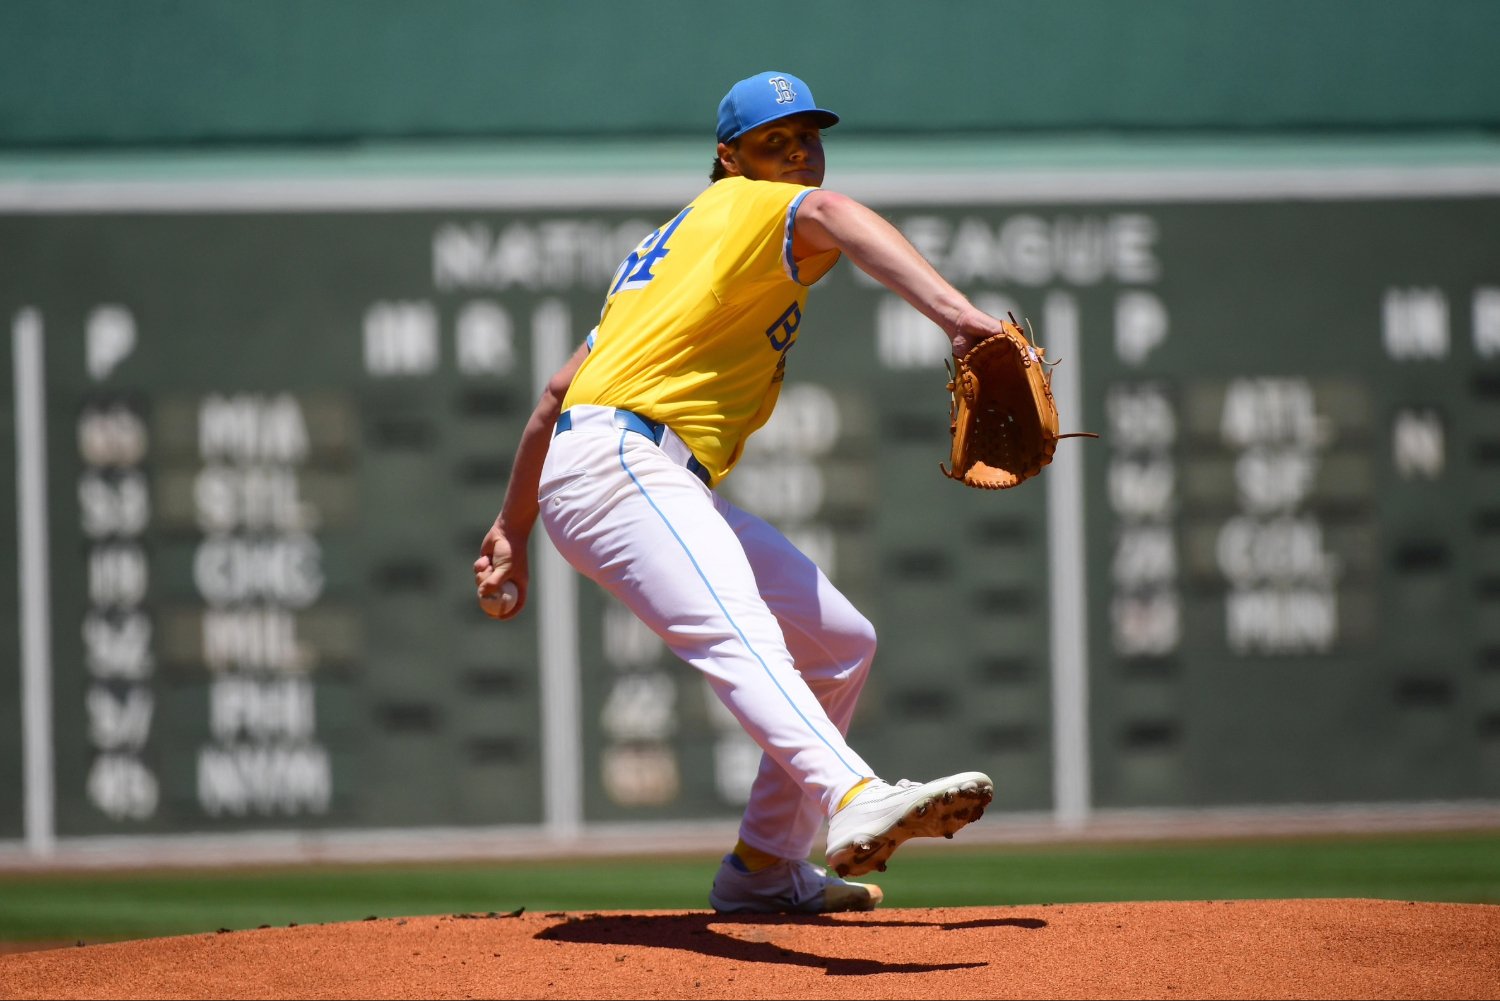
Since making his MLB debut on May 1, Jake Bennett has posted a 3.27 ERA and a 3.11 FIP through six starts. Those are impressive numbers for a rookie, but they raise a more interesting question than the results themselves: How is he doing this with a repertoire that lacks a true overpowering pitch? Bennett doesn't throw 100 mph. He doesn't feature a wipeout slider. He has five pitches, none of which qualifies as elite on its own. Yet he just held the Yankees to three hits across 6 1/3 innings. No single pitch explains Bennett's success, but the way they work together does. His changeup does more than generate whiffs, it forces hitters to respect a speed differential that makes both his four-seam fastball and sinker play above their raw quality. Bennett throws the changeup 25.1% of the time. Hitters chase it outside the strike zone 39% of the time and swing through 34.7% of those chases. Even when they make contact, they produce just a .151 expected batting average and a .166 expected slugging percentage. Those are elite results. More important, they explain why the rest of Bennett's arsenal works. His four-seam fastball carries a .301 expected slugging percentage against, while the sinker sits at .388. Neither pitch overwhelms hitters on its own. But opponents can't simply sit on either one because they always have to account for the possibility of the changeup. Jake Bennett's MLB pitch mix (2026) Pitch Usage% Whiff% xBA xSLG HardHit% Fourseam 33.0% 29.2% .187 .301 42.3% Changeup 25.1% 34.7% .151 .166 23.8% Sinker 28.4% 8.2% .250 .388 37.8% Sweeper 5.8% 28.6% .303 .421 20.0% Curveball 4.6% 18.2% .223 .730 25.0% Movement is what separates the changeup from the rest of the group. It averages 82.8 mph, nearly 10 mph slower than Bennett’s 92.5 mph sinker, while generating roughly 12 inches of horizontal break. Out of his hand, it resembles a fastball. By the time hitters recognize the difference, their swing decision has already been made. The pitch has produced just a .238 batting average on balls in play, and the quality of contact is even more telling. Hitters rarely square it up. They arrive late, swing underneath it or catch it off the end of the bat, leading to a 23.8% hard-hit rate, the lowest of any pitch Bennett throws. His approach also changes with the count. Bennett has thrown 52% of his changeups while ahead, repeatedly starting the pitch on the edge of the strike zone before letting it fade away from barrels. Hitters chase it outside the zone, making contact on only 57.6% of those swings, well below the league average. That approach helped him retire 14 of the first 15 batters he faced in his latest outing. Bat tracking metrics reinforce the same point. Only 2.9% of contact against Bennett’s changeup qualifies as perfect contact. Seventy percent of swings produce flawed contact, and hitters properly match the bat to the ball’s path only 35.7% of the time. Contact quality by pitch (Bat Tracking) Pitch Perfect Contact % Flawed Swing % Lined Up % Changeup 2.9% 70.0% 35.7% Four-seam 6.0% 55.0% 30.6% Sinker 9.0% 9.0% 8.7% Hitters fail to line up Bennett's four-seam fastball 69.4% of the time and his sinker 91.3% of the time. The changeup is different because it wins before contact ever happens. Hitters commit to the wrong pitch, and the quality of contact suffers as a result. The Yankees saw that firsthand on Saturday. Bennett threw 87 pitches—34% four-seamers, 30% sinkers and 23% changeups. Afterward, Bennett explained where part of that plan came from. "Being able to watch Payton Tolle and Connelly Early pitch and have so much success really helped me formulate my game plan." He's studying what works for fellow left-handers and adapting those ideas to his own strengths. Bennett will never be a power pitcher. No individual pitch grades as a true plus offering, yet together they create a repertoire that's far more difficult to solve than its individual pieces suggest. The margin for error, though, is small. If hitters stop chasing the changeup outside the strike zone, Bennett will have to throw more fastballs and sinkers in the zone. His four-seamer has allowed a 42.3% hard-hit rate. His sinker sits at 37.8%. Asking those pitches to carry more of the workload could expose the repertoire. That makes command—and the continued development of his curveball and sweeper—the next step in his progression. For now, Bennett has shown that sequencing, command and pitch design can still beat pure velocity. The Red Sox have now produced 10 consecutive quality starts, and during a first half defined by injuries and inconsistency, Bennett's emergence alongside Tolle and Early has become one of the organization's few genuinely encouraging developments. View full article
-
How Jake Bennett Is Succeeding Without A Dominant Pitch
Yirsandy Rodríguez posted an article in Red Sox
 Since making his MLB debut on May 1, Jake Bennett has posted a 3.27 ERA and a 3.11 FIP through six starts. Those are impressive numbers for a rookie, but they raise a more interesting question than the results themselves: How is he doing this with a repertoire that lacks a true overpowering pitch? Bennett doesn't throw 100 mph. He doesn't feature a wipeout slider. He has five pitches, none of which qualifies as elite on its own. Yet he just held the Yankees to three hits across 6 1/3 innings. No single pitch explains Bennett's success, but the way they work together does. His changeup does more than generate whiffs, it forces hitters to respect a speed differential that makes both his four-seam fastball and sinker play above their raw quality. Bennett throws the changeup 25.1% of the time. Hitters chase it outside the strike zone 39% of the time and swing through 34.7% of those chases. Even when they make contact, they produce just a .151 expected batting average and a .166 expected slugging percentage. Those are elite results. More important, they explain why the rest of Bennett's arsenal works. His four-seam fastball carries a .301 expected slugging percentage against, while the sinker sits at .388. Neither pitch overwhelms hitters on its own. But opponents can't simply sit on either one because they always have to account for the possibility of the changeup. Jake Bennett's MLB pitch mix (2026) Pitch Usage% Whiff% xBA xSLG HardHit% Fourseam 33.0% 29.2% .187 .301 42.3% Changeup 25.1% 34.7% .151 .166 23.8% Sinker 28.4% 8.2% .250 .388 37.8% Sweeper 5.8% 28.6% .303 .421 20.0% Curveball 4.6% 18.2% .223 .730 25.0% Movement is what separates the changeup from the rest of the group. It averages 82.8 mph, nearly 10 mph slower than Bennett’s 92.5 mph sinker, while generating roughly 12 inches of horizontal break. Out of his hand, it resembles a fastball. By the time hitters recognize the difference, their swing decision has already been made. The pitch has produced just a .238 batting average on balls in play, and the quality of contact is even more telling. Hitters rarely square it up. They arrive late, swing underneath it or catch it off the end of the bat, leading to a 23.8% hard-hit rate, the lowest of any pitch Bennett throws. His approach also changes with the count. Bennett has thrown 52% of his changeups while ahead, repeatedly starting the pitch on the edge of the strike zone before letting it fade away from barrels. Hitters chase it outside the zone, making contact on only 57.6% of those swings, well below the league average. That approach helped him retire 14 of the first 15 batters he faced in his latest outing. Bat tracking metrics reinforce the same point. Only 2.9% of contact against Bennett’s changeup qualifies as perfect contact. Seventy percent of swings produce flawed contact, and hitters properly match the bat to the ball’s path only 35.7% of the time. Contact quality by pitch (Bat Tracking) Pitch Perfect Contact % Flawed Swing % Lined Up % Changeup 2.9% 70.0% 35.7% Four-seam 6.0% 55.0% 30.6% Sinker 9.0% 9.0% 8.7% Hitters fail to line up Bennett's four-seam fastball 69.4% of the time and his sinker 91.3% of the time. The changeup is different because it wins before contact ever happens. Hitters commit to the wrong pitch, and the quality of contact suffers as a result. The Yankees saw that firsthand on Saturday. Bennett threw 87 pitches—34% four-seamers, 30% sinkers and 23% changeups. Afterward, Bennett explained where part of that plan came from. "Being able to watch Payton Tolle and Connelly Early pitch and have so much success really helped me formulate my game plan." He's studying what works for fellow left-handers and adapting those ideas to his own strengths. Bennett will never be a power pitcher. No individual pitch grades as a true plus offering, yet together they create a repertoire that's far more difficult to solve than its individual pieces suggest. The margin for error, though, is small. If hitters stop chasing the changeup outside the strike zone, Bennett will have to throw more fastballs and sinkers in the zone. His four-seamer has allowed a 42.3% hard-hit rate. His sinker sits at 37.8%. Asking those pitches to carry more of the workload could expose the repertoire. That makes command—and the continued development of his curveball and sweeper—the next step in his progression. For now, Bennett has shown that sequencing, command and pitch design can still beat pure velocity. The Red Sox have now produced 10 consecutive quality starts, and during a first half defined by injuries and inconsistency, Bennett's emergence alongside Tolle and Early has become one of the organization's few genuinely encouraging developments.
 -
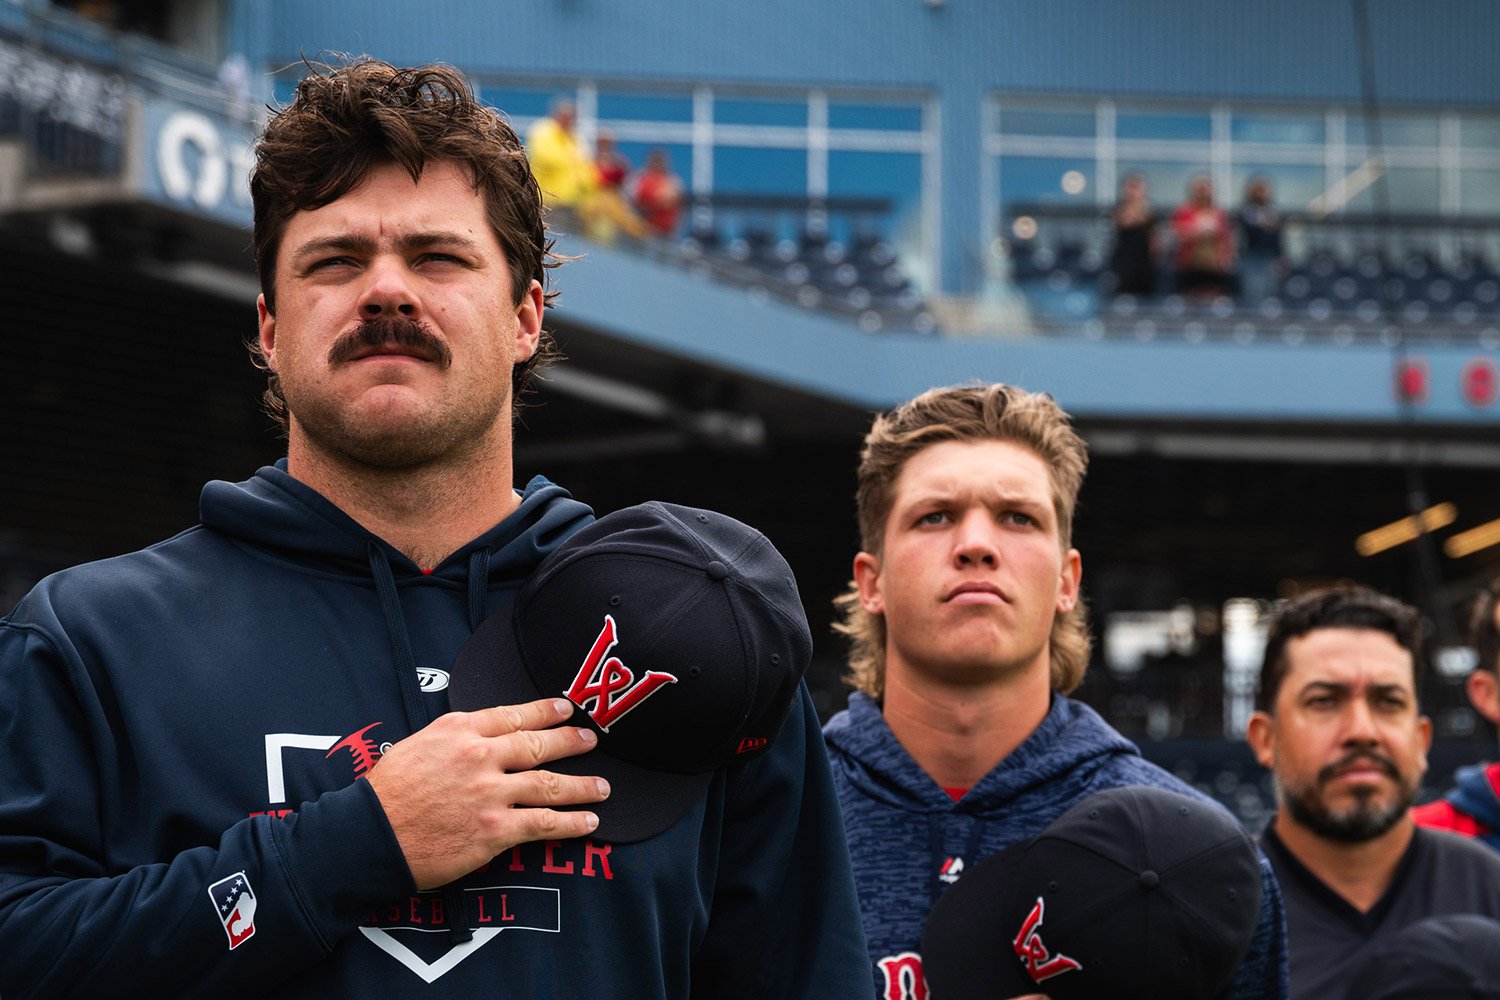
When the Boston Red Sox assembled their rotation for 2026, they envisioned something very different. Garrett Crochet was supposed to be the centerpiece. Brayan Bello was expected to solidify himself as one of the group’s long-term pillars. Veteran arms would provide reliability while younger pitchers continued their development. It wasn’t a flawless plan, but it was a clear one, and one Boston believed it could build around. Crochet made only six starts before suffering an injury. Bello never found consistency. Johan Oviedo effectively lost the season. Patrick Sandoval’s return timetable stretched far longer than expected. As the months passed, it appeared the organization’s pitching depth was about to face its toughest test. While much of the attention remained on the injured list and the pitchers who failed to meet expectations, the Red Sox quietly began uncovering a new backbone for their staff. Alongside veteran leader Sonny Gray, Ranger Suárez brought consistency. Payton Tolle flashed the upside of a pitcher capable of becoming much more. Connelly Early stepped in and shouldered meaningful innings at exactly the right time. None of them entered the season expected to become central figures in Boston’s plans. Now it is nearly impossible to explain where the Red Sox stand without mentioning all three. Pitcher IP ERA FIP WAR Ranger Suárez 76 2.93 2.84 2.3 Payton Tolle 58 2.93 3.09 1.7 Connelly Early 81 3.64 4.87 0.4 Suárez may be the easiest pitcher in this group to overlook. He does not light up radar guns. His average fastball sits just above 91 mph. He also does not rank among the staff leaders in pure stuff metrics. Yet the results continue to follow, and the explanation lies in the way he attacks hitters. While many starters rely on power, Suárez builds his outings through location, sequencing, and execution. His 105 Location+ reflects a pitcher who understands how to manipulate an at-bat, move hitters around the strike zone, and force uncomfortable decisions. His success is not tied to a single dominant weapon but to a combination of command, intelligence, and an ability to avoid damaging mistakes. That formula has allowed him to remain effective against hitters from both sides of the plate while emerging as Boston’s most dependable starter through the first half. Every young rotation needs a stabilizing presence. Not necessarily an ace, but someone capable of stopping problems from snowballing when adversity arrives. Suárez has filled that role better than anyone could have anticipated. If Ranger Suárez represents reliability, Payton Tolle represents upside. The 24-year-old left-hander possesses the kind of arsenal that can alter an organization’s outlook. His fastball averages 96.4 mph, and his 115 Stuff+ ranks first among Boston starters. But the most intriguing part of his profile is not the velocity or any individual metric. Tolle generates swings. He generates chase. He puts opponents in a position where they must respond to his pitches rather than dictate the at-bat themselves. No starter on the staff produces more swings or a higher chase rate. That kind of ability is difficult to teach. Pitcher K% BB% Stuff+ Pitching+ Payton Tolle 25.4% 6.8% 115 107 Ranger Suárez 24.2% 7.7% 95 100 Connelly Early 22.5% 8.8% 102 99 June brought the first meaningful adjustments from opposing hitters and a slight decline in Tolle’s strikeout rate. That is a natural stage in the development of any young pitcher who begins accumulating major-league exposure. Hitters study tendencies, identify patterns, and eventually force a counterpunch. The velocity is still there. The swing-and-miss ability is still there. The traits that make him such an intriguing long-term piece are still there. The next stage of his development will be proving he can adapt as quickly as opposing hitters do. Then there is Early, whose contribution may be the least flashy and, in many ways, one of the most valuable. Unlike Tolle, he is not viewed as a future star. Unlike Suárez, he does not thrive through elite command. What he has done instead is something every organization needs and rarely celebrates enough: take the ball every fifth day and continue piling up innings. The underlying metrics suggest some regression could eventually arrive. His ERA has outperformed both his FIP and xFIP, and several recent indicators point in that direction. But even if some correction comes, it does not diminish what he has already provided during a season defined by uncertainty. Boston needed someone capable of keeping the rotation afloat. Early answered the call. Boston needed someone who could prevent every injury from becoming a larger problem. He answered that call as well. That type of value often receives less attention than it deserves. What makes this story especially compelling is that it does not require ignoring the questions that remain. Concerns about Crochet’s health have not disappeared. Bello is still searching for answers. The rotation remains a work in progress. But the Red Sox now possess something that seemed far less certain a few months ago: multiple avenues toward a sustainable future. Suárez has shown he can stabilize the rotation today. Tolle has displayed the tools to grow into a far larger role. Early has proven he belongs in a major-league rotation. Perhaps none of them were part of the original blueprint. Then again, organizations often discover their best solutions only after they are forced to abandon the script. And if Boston eventually builds its next great rotation, there is a chance the story begins here—with three pitchers who stepped into an unexpected opportunity and turned it into something much larger. View full article
-
 When the Boston Red Sox assembled their rotation for 2026, they envisioned something very different. Garrett Crochet was supposed to be the centerpiece. Brayan Bello was expected to solidify himself as one of the group’s long-term pillars. Veteran arms would provide reliability while younger pitchers continued their development. It wasn’t a flawless plan, but it was a clear one, and one Boston believed it could build around. Crochet made only six starts before suffering an injury. Bello never found consistency. Johan Oviedo effectively lost the season. Patrick Sandoval’s return timetable stretched far longer than expected. As the months passed, it appeared the organization’s pitching depth was about to face its toughest test. While much of the attention remained on the injured list and the pitchers who failed to meet expectations, the Red Sox quietly began uncovering a new backbone for their staff. Alongside veteran leader Sonny Gray, Ranger Suárez brought consistency. Payton Tolle flashed the upside of a pitcher capable of becoming much more. Connelly Early stepped in and shouldered meaningful innings at exactly the right time. None of them entered the season expected to become central figures in Boston’s plans. Now it is nearly impossible to explain where the Red Sox stand without mentioning all three. Pitcher IP ERA FIP WAR Ranger Suárez 76 2.93 2.84 2.3 Payton Tolle 58 2.93 3.09 1.7 Connelly Early 81 3.64 4.87 0.4 Suárez may be the easiest pitcher in this group to overlook. He does not light up radar guns. His average fastball sits just above 91 mph. He also does not rank among the staff leaders in pure stuff metrics. Yet the results continue to follow, and the explanation lies in the way he attacks hitters. While many starters rely on power, Suárez builds his outings through location, sequencing, and execution. His 105 Location+ reflects a pitcher who understands how to manipulate an at-bat, move hitters around the strike zone, and force uncomfortable decisions. His success is not tied to a single dominant weapon but to a combination of command, intelligence, and an ability to avoid damaging mistakes. That formula has allowed him to remain effective against hitters from both sides of the plate while emerging as Boston’s most dependable starter through the first half. Every young rotation needs a stabilizing presence. Not necessarily an ace, but someone capable of stopping problems from snowballing when adversity arrives. Suárez has filled that role better than anyone could have anticipated. If Ranger Suárez represents reliability, Payton Tolle represents upside. The 24-year-old left-hander possesses the kind of arsenal that can alter an organization’s outlook. His fastball averages 96.4 mph, and his 115 Stuff+ ranks first among Boston starters. But the most intriguing part of his profile is not the velocity or any individual metric. Tolle generates swings. He generates chase. He puts opponents in a position where they must respond to his pitches rather than dictate the at-bat themselves. No starter on the staff produces more swings or a higher chase rate. That kind of ability is difficult to teach. Pitcher K% BB% Stuff+ Pitching+ Payton Tolle 25.4% 6.8% 115 107 Ranger Suárez 24.2% 7.7% 95 100 Connelly Early 22.5% 8.8% 102 99 June brought the first meaningful adjustments from opposing hitters and a slight decline in Tolle’s strikeout rate. That is a natural stage in the development of any young pitcher who begins accumulating major-league exposure. Hitters study tendencies, identify patterns, and eventually force a counterpunch. The velocity is still there. The swing-and-miss ability is still there. The traits that make him such an intriguing long-term piece are still there. The next stage of his development will be proving he can adapt as quickly as opposing hitters do. Then there is Early, whose contribution may be the least flashy and, in many ways, one of the most valuable. Unlike Tolle, he is not viewed as a future star. Unlike Suárez, he does not thrive through elite command. What he has done instead is something every organization needs and rarely celebrates enough: take the ball every fifth day and continue piling up innings. The underlying metrics suggest some regression could eventually arrive. His ERA has outperformed both his FIP and xFIP, and several recent indicators point in that direction. But even if some correction comes, it does not diminish what he has already provided during a season defined by uncertainty. Boston needed someone capable of keeping the rotation afloat. Early answered the call. Boston needed someone who could prevent every injury from becoming a larger problem. He answered that call as well. That type of value often receives less attention than it deserves. What makes this story especially compelling is that it does not require ignoring the questions that remain. Concerns about Crochet’s health have not disappeared. Bello is still searching for answers. The rotation remains a work in progress. But the Red Sox now possess something that seemed far less certain a few months ago: multiple avenues toward a sustainable future. Suárez has shown he can stabilize the rotation today. Tolle has displayed the tools to grow into a far larger role. Early has proven he belongs in a major-league rotation. Perhaps none of them were part of the original blueprint. Then again, organizations often discover their best solutions only after they are forced to abandon the script. And if Boston eventually builds its next great rotation, there is a chance the story begins here—with three pitchers who stepped into an unexpected opportunity and turned it into something much larger.
 -
A catcher’s value is rarely found where most fans are looking. While Carlos Narváez continues searching for consistency at the plate, the Boston Red Sox may have already discovered something just as important: one of the American League’s most complete defensive catchers. The bat still has room to develop. A 53 wRC+ and -7.7 offensive runs reflect a player who has yet to establish himself at the plate at the MLB level. But those numbers also risk obscuring the bigger picture. Narváez is already providing value in some of the hardest areas of the game to measure—areas that rarely make highlight reels but often influence the outcome of games. What makes his emergence especially intriguing is that it is not being driven by one extraordinary physical tool. Instead, Narváez has built his profile through the accumulation of countless small advantages, executed with remarkable consistency. Carlos Narvaez Controls the Running Game Without A Cannon Arm For years, the image of an elite defensive catcher was tied to arm strength. The best catchers were the ones capable of discouraging runners before they even attempted a steal. Narváez is proving there is another way. With an average throwing velocity of 76.3 mph, his arm strength falls well below that of specialists such as J.T. Realmuto or Dillon Dingler. On paper, there is little reason to expect him to rank among baseball’s most effective catchers at controlling the running game. And yet, the results suggest otherwise. Since 2025, Narváez has accumulated +6.0 Catcher Stealing Runs, the fourth-highest total among major-league catchers. He has also recorded +9.3 Caught Stealings Above Average after throwing out 29 of the 103 runners who have attempted to steal against him. Running Game Leaders (Since 2025) Narváez consistently posts excellent transfer times from glove to throwing hand while maintaining the accuracy necessary to maximize every opportunity. The ball gets out quickly, arrives on target, and gives his middle infielders a chance to finish the play. Sure, it lacks the flash of a rocket throw to second base, but the value is no different. At catcher, fractions of a second often separate a stolen base from an out. Clean mechanics, efficient footwork, and precise execution can be just as impactful as elite arm strength. Stealing Strikes Is Another Way to Win Games A catcher’s defensive influence does not end when runners stay put, of course. Every pitch received presents an opportunity to affect an at-bat. One extra strike in a 2-2 or 3-2 count can completely alter the outcome of a plate appearance, and Narváez has quietly become one of the better practitioners of that craft. His framing metrics credit him with +3 runs, placing him among the most effective receivers in baseball this season. Only Adley Rutschman, Dillon Dingler, Brandon Valenzuela, and Austin Wells have produced better framing results. Catcher Defensive Value (2026) His blocking metrics grade out around league average, but that is part of what makes his overall profile so impressive. Narváez does not need to compensate for a glaring weakness because, to this point, one has not emerged. Positive framing, elite control of the running game, and stable performance in virtually every other defensive responsibility is a profile that, for a catcher with limited big-league experience, is an unusually complete package. A Defensive Reputation Built Through Accumulation Many catchers build their reputations around one defining skill. Realmuto became synonymous with arm strength. Patrick Bailey established himself through elite framing. Others derive much of their value from offensive production. Narváez is more well-rounded than most of his contemporaries. That type of profile tends to inspire confidence within an organization because it is not dependent on one rare physical tool. Technique, preparation, anticipation, and repetition are skills that can sustain value over time, and Narváez is already showing how impactful they can be. The offense will ultimately determine his ceiling. If he develops into even an average hitter for the position, his overall value would rise significantly. But that future offensive growth does not need to arrive before the Red Sox recognize what they already have. Narváez makes everyone around him better, which is perhaps the single-most important trait a catcher can have. View full article
-
 A catcher’s value is rarely found where most fans are looking. While Carlos Narváez continues searching for consistency at the plate, the Boston Red Sox may have already discovered something just as important: one of the American League’s most complete defensive catchers. The bat still has room to develop. A 53 wRC+ and -7.7 offensive runs reflect a player who has yet to establish himself at the plate at the MLB level. But those numbers also risk obscuring the bigger picture. Narváez is already providing value in some of the hardest areas of the game to measure—areas that rarely make highlight reels but often influence the outcome of games. What makes his emergence especially intriguing is that it is not being driven by one extraordinary physical tool. Instead, Narváez has built his profile through the accumulation of countless small advantages, executed with remarkable consistency. Carlos Narvaez Controls the Running Game Without A Cannon Arm For years, the image of an elite defensive catcher was tied to arm strength. The best catchers were the ones capable of discouraging runners before they even attempted a steal. Narváez is proving there is another way. With an average throwing velocity of 76.3 mph, his arm strength falls well below that of specialists such as J.T. Realmuto or Dillon Dingler. On paper, there is little reason to expect him to rank among baseball’s most effective catchers at controlling the running game. And yet, the results suggest otherwise. Since 2025, Narváez has accumulated +6.0 Catcher Stealing Runs, the fourth-highest total among major-league catchers. He has also recorded +9.3 Caught Stealings Above Average after throwing out 29 of the 103 runners who have attempted to steal against him. Running Game Leaders (Since 2025) Narváez consistently posts excellent transfer times from glove to throwing hand while maintaining the accuracy necessary to maximize every opportunity. The ball gets out quickly, arrives on target, and gives his middle infielders a chance to finish the play. Sure, it lacks the flash of a rocket throw to second base, but the value is no different. At catcher, fractions of a second often separate a stolen base from an out. Clean mechanics, efficient footwork, and precise execution can be just as impactful as elite arm strength. Stealing Strikes Is Another Way to Win Games A catcher’s defensive influence does not end when runners stay put, of course. Every pitch received presents an opportunity to affect an at-bat. One extra strike in a 2-2 or 3-2 count can completely alter the outcome of a plate appearance, and Narváez has quietly become one of the better practitioners of that craft. His framing metrics credit him with +3 runs, placing him among the most effective receivers in baseball this season. Only Adley Rutschman, Dillon Dingler, Brandon Valenzuela, and Austin Wells have produced better framing results. Catcher Defensive Value (2026) His blocking metrics grade out around league average, but that is part of what makes his overall profile so impressive. Narváez does not need to compensate for a glaring weakness because, to this point, one has not emerged. Positive framing, elite control of the running game, and stable performance in virtually every other defensive responsibility is a profile that, for a catcher with limited big-league experience, is an unusually complete package. A Defensive Reputation Built Through Accumulation Many catchers build their reputations around one defining skill. Realmuto became synonymous with arm strength. Patrick Bailey established himself through elite framing. Others derive much of their value from offensive production. Narváez is more well-rounded than most of his contemporaries. That type of profile tends to inspire confidence within an organization because it is not dependent on one rare physical tool. Technique, preparation, anticipation, and repetition are skills that can sustain value over time, and Narváez is already showing how impactful they can be. The offense will ultimately determine his ceiling. If he develops into even an average hitter for the position, his overall value would rise significantly. But that future offensive growth does not need to arrive before the Red Sox recognize what they already have. Narváez makes everyone around him better, which is perhaps the single-most important trait a catcher can have.
 -
Caleb Durbin’s rise didn’t begin when the hits started falling. It began when the ball stopped ending up on the ground. That single change helps explain almost everything that has happened over the past month. After spending much of the season making contact without doing much damage, Durbin has transformed the shape of his offensive game. Groundballs have become line drives and fly balls. Extra-base hits have started to follow. For the first time in Boston, he looks remarkably close to the hitter the Red Sox believed they were acquiring. The results reflected his early struggles. Durbin posted a 45 wRC+ in March and April, followed by a 41 mark in May. He was still putting the ball in play, still showing the bat-to-ball ability that had defined his climb through the minors, but too many plate appearances ended the same way: a ground ball, a routine out, and another missed opportunity. Then June arrived. Suddenly, the same player looked different. Durbin hit .309 with a .600 slugging percentage and a 146 wRC+ during the month, emerging as one of Boston's most productive hitters. The obvious question is whether this is simply a hot streak, or something he can actually build upon. Caleb Durbin Has Made Groundballs Disappear The most important change in Durbin’s profile is found in the type of contact he is producing. Players with his skill set often walk a narrow path offensively. Without elite raw power, they must create value through contact quality, athleticism, and smart swing decisions. Making contact alone is not enough; the contact has to matter. For much of the season, it did not. During March and April, 61 percent of Durbin’s balls in play were hit on the ground. While ground balls can benefit players with speed, they also limit offensive upside. It is difficult to drive the baseball when most of your contact never leaves the infield dirt. Luckily, we've started to see a paradigm shift here in June. Month GB% FB% LD% HR/FB Mar/Apr 61.0% 25.6% 13.4% 4.8% May 50.0% 33.3% 16.7% 0.0% June 32.7% 46.9% 20.4% 17.4% There's nothing hiding in that data. The ground balls steadily disappeared, the line drives increased, and the fly balls nearly doubled. That alone is a change worth celebrating, before we even get into the actual results. His average launch angle climbed from 5.1 degrees in March and April to 17.9 degrees in June. His barrel rate increased from 1.2 percent to 6.0 percent. His hard-hit rate moved in the same direction. At long last, he's hitting like a major leaguer again. Better Discipline Begets Better Contact What makes this breakout particularly intriguing is how it happened. Many hitters attempt to unlock power by swinging harder and accepting more strikeouts as the cost of doing business. Durbin has taken a different path: His strikeout rate actually dropped to 10.3 percent in June. Month Z-Swing% Swing% Contact% Bat Speed Mar/Apr 56.7% 41.9% 86.5% 67.9 mph May 64.1% 46.7% 81.7% 68.2 mph June 74.1% 52.1% 88.1% 69.8 mph Durbin is swinging more often than he was earlier in the season, but not because he has become reckless (his chase rates have remained under control). Instead, he has become significantly more aggressive against strikes. You don't need me to tell you this, but more aggressive swings at the right pitches lead to better contact. Better contact leads to more damage. And when a hitter can create that damage without sacrificing contact ability, their offensive outlook changes. What This Means For Durbin, Red Sox Going Forward The most important question is not whether Caleb Durbin can maintain a .600 slugging percentage. Truth be told, he he probably can't. Very few hitters can sustain that level of production over a full season, and his expected metrics suggest some regression is likely. However, Durbin’s improvement is supported by better swing decisions, increased bat speed, a dramatically different batted-ball profile, and expected metrics that are moving in the same direction as the results. Those are precisely the indicators teams trust when evaluating whether a breakout is real. Durbin has always possessed the contact skills -- he proved it last year in Milwaukee with the Brewers. It took him a while to find his way after that shocking trade in February, but it appears he's finally found a way to marry impact with those innate talents. If he sustains it, that trade may not age quite as poorly as we've all feared. View full article
-
 Caleb Durbin’s rise didn’t begin when the hits started falling. It began when the ball stopped ending up on the ground. That single change helps explain almost everything that has happened over the past month. After spending much of the season making contact without doing much damage, Durbin has transformed the shape of his offensive game. Groundballs have become line drives and fly balls. Extra-base hits have started to follow. For the first time in Boston, he looks remarkably close to the hitter the Red Sox believed they were acquiring. The results reflected his early struggles. Durbin posted a 45 wRC+ in March and April, followed by a 41 mark in May. He was still putting the ball in play, still showing the bat-to-ball ability that had defined his climb through the minors, but too many plate appearances ended the same way: a ground ball, a routine out, and another missed opportunity. Then June arrived. Suddenly, the same player looked different. Durbin hit .309 with a .600 slugging percentage and a 146 wRC+ during the month, emerging as one of Boston's most productive hitters. The obvious question is whether this is simply a hot streak, or something he can actually build upon. Caleb Durbin Has Made Groundballs Disappear The most important change in Durbin’s profile is found in the type of contact he is producing. Players with his skill set often walk a narrow path offensively. Without elite raw power, they must create value through contact quality, athleticism, and smart swing decisions. Making contact alone is not enough; the contact has to matter. For much of the season, it did not. During March and April, 61 percent of Durbin’s balls in play were hit on the ground. While ground balls can benefit players with speed, they also limit offensive upside. It is difficult to drive the baseball when most of your contact never leaves the infield dirt. Luckily, we've started to see a paradigm shift here in June. Month GB% FB% LD% HR/FB Mar/Apr 61.0% 25.6% 13.4% 4.8% May 50.0% 33.3% 16.7% 0.0% June 32.7% 46.9% 20.4% 17.4% There's nothing hiding in that data. The ground balls steadily disappeared, the line drives increased, and the fly balls nearly doubled. That alone is a change worth celebrating, before we even get into the actual results. His average launch angle climbed from 5.1 degrees in March and April to 17.9 degrees in June. His barrel rate increased from 1.2 percent to 6.0 percent. His hard-hit rate moved in the same direction. At long last, he's hitting like a major leaguer again. Better Discipline Begets Better Contact What makes this breakout particularly intriguing is how it happened. Many hitters attempt to unlock power by swinging harder and accepting more strikeouts as the cost of doing business. Durbin has taken a different path: His strikeout rate actually dropped to 10.3 percent in June. Month Z-Swing% Swing% Contact% Bat Speed Mar/Apr 56.7% 41.9% 86.5% 67.9 mph May 64.1% 46.7% 81.7% 68.2 mph June 74.1% 52.1% 88.1% 69.8 mph Durbin is swinging more often than he was earlier in the season, but not because he has become reckless (his chase rates have remained under control). Instead, he has become significantly more aggressive against strikes. You don't need me to tell you this, but more aggressive swings at the right pitches lead to better contact. Better contact leads to more damage. And when a hitter can create that damage without sacrificing contact ability, their offensive outlook changes. What This Means For Durbin, Red Sox Going Forward The most important question is not whether Caleb Durbin can maintain a .600 slugging percentage. Truth be told, he he probably can't. Very few hitters can sustain that level of production over a full season, and his expected metrics suggest some regression is likely. However, Durbin’s improvement is supported by better swing decisions, increased bat speed, a dramatically different batted-ball profile, and expected metrics that are moving in the same direction as the results. Those are precisely the indicators teams trust when evaluating whether a breakout is real. Durbin has always possessed the contact skills -- he proved it last year in Milwaukee with the Brewers. It took him a while to find his way after that shocking trade in February, but it appears he's finally found a way to marry impact with those innate talents. If he sustains it, that trade may not age quite as poorly as we've all feared.
 -
 mvp 78 reacted to a post in a topic:
Ceddanne Rafaela Is Succeeding By Breaking One of Hitting’s Basic Rules
mvp 78 reacted to a post in a topic:
Ceddanne Rafaela Is Succeeding By Breaking One of Hitting’s Basic Rules
-
mvp 78 reacted to a post in a topic:
Ceddanne Rafaela Is Succeeding By Breaking One of Hitting’s Basic Rules
-
That's actually a really interesting way to look at it. I think the key distinction is that Rafaela isn't succeeding because he's chasing pitches. He's succeeding because he's an unusually gifted bat-to-ball hitter who remains committed to being aggressive. Those are not necessarily the same thing. Historically, most hitters who expand the zone this much eventually run into trouble because pitchers exploit that tendency. That's why the skepticism exists. The numbers tell us that maintaining elite production while swinging at more than 60% of pitches outside the strike zone is incredibly difficult. At the same time, there is also a danger in assuming every hitter should follow the same blueprint. Rafaela has never been a hitter built around patience, deep counts, or drawing walks. His offensive value comes from his athleticism, hand-eye coordination, bat speed, and ability to put the ball in play. Asking him to become a passive hitter might actually take him away from what he does best. What makes this worth monitoring isn't whether he's suddenly discovered the "correct" approach. It's whether his unique skill set allows him to survive with an approach that would sink most hitters. Some players break conventional rules because they're exceptional at a specific skill, and Rafaela's contact ability may be one of those exceptions. I still think sustaining this level of production will be difficult. But I agree that the explanation may not be as simple as "he's hot" or "he's lucky." There may be a real baseball reason behind it: Rafaela is at his best when he's attacking rather than thinking.
-
 Yirsandy Rodríguez reacted to a post in a topic:
Ceddanne Rafaela Is Succeeding By Breaking One of Hitting’s Basic Rules
Yirsandy Rodríguez reacted to a post in a topic:
Ceddanne Rafaela Is Succeeding By Breaking One of Hitting’s Basic Rules
-
Pitchers spend a significant portion of their game plans trying to get hitters to expand the strike zone. When they succeed, they usually gain the upper hand. Swings at bad pitches often result in weak contact, whiffs, or strikeouts. Ceddanne Rafaela is becoming an exception to that rule. After hovering around a 37% chase rate during the first two months of the season, Rafaela has taken his aggressiveness to another level in June. His O-Swing% (the rate at which a hitter swings at pitches outside the strike zone) has jumped to an astonishing 60.2%, the highest mark in Major League Baseball so far this month. Boston Red Sox fans won't be too surprised by that fact, but the context makes the number even more remarkable. Ezequiel Tovar ranks second at 56.7%, while Salvador Perez sits third at 54.3%. Rafaela not only leads the leaderboard, but does so by a considerable margin. Hitters With the Highest Chase Rates in June 2026 Player O-Swing% O-Contact% Contact% Ceddanne Rafaela 60.2% 72.6% 80.0% Ezequiel Tovar 56.7% 54.9% 67.3% Salvador Pérez 54.3% 71.9% 79.4% Ernie Clement 53.0% 70.5% 80.9% Kerry Carpenter 51.8% 79.1% 83.9% Michael Harris II 51.0% 69.8% 78.2% Mauricio Dubón 49.6% 81.7% 87.5% Cody Bellinger 49.5% 77.8% 80.4% Ángel Martínez 49.5% 75.6% 78.4% Andrés Giménez 49.4% 72.1% 76.8% The table helps put the number into perspective. Rafaela not only leads MLB in chase rate during June, but also owns one of the strongest contact profiles among this group, an unusual combination for such an aggressive hitter. Normally, a spike of this magnitude in chase rate comes with more whiffs, more strikeouts, and a decline in offensive production. Rafaela, however, has produced the exact opposite outcome. So far in June, he is hitting .333/.348/.533 with an .881 OPS and a 139 wRC+, numbers that have made him one of Boston’s most productive hitters during the month. Although his walk rate has fallen to just 2.2%, he has compensated for it with a combination of contact ability, speed, and production whenever he puts the ball in play. The answer to our paradox lies in how his contact profile has evolved. What stands out is that the increase in aggressiveness has been accompanied by better contact rates. His O-Contact% has climbed to 72.6%, while his Z-Contact% has reached 90.7%, both season highs. The result is an overall contact rate of 80%, enough to prevent the added chasing from turning into a strikeout problem. That helps explain why his strikeout rate sits at just 17.4% in June, below his season average and far removed from the 31.5% mark he posted during his MLB debut in 2023. In fact, Rafaela’s overall development as a hitter has been more substantial than the usual conversations about his plate discipline suggest. His strikeout rate fell from 31.5% in 2023 to 26.4% in 2024, then to 19.9% in 2025, and currently sits at 20.5%. At the same time, his offensive line has improved to .286/.341/.450 this season, good for a career-best 116 wRC+. That progress has come without a dramatic overhaul of his approach. Rafaela remains one of the most aggressive hitters in baseball. The difference is that he is now reducing the cost of that aggressiveness. This chart shows Rafaela’s wOBA production against pitches outside the strike zone during March and April: There was only one clear weakness: pitches located low and inside. Now let's look at the map for June. The weakness against low-and-in pitches has largely disappeared, and more broadly, he has produced across the strike zone in a way few hitters in the league have managed this season. It's a trend worth monitoring as the season unfolds. The underlying metrics suggest that part of his current production may be difficult to sustain. His .299 xwOBA remains well below his actual .348 wOBA, while his expected batting average (.247) also trails his actual mark (.286). In addition, his .343 BABIP sits noticeably above the levels he posted in previous seasons. Even so, the gains in contact ability and strikeout reduction appear genuine. Rafaela no longer relies exclusively on his speed or defense to generate value. He is also showing tangible growth as a hitter without losing his identity at the plate. That is what makes Rafaela such a fascinating player to watch right now. So far in June, he leads Major League Baseball in swings at pitches outside the strike zone, a statistic that would normally signal offensive trouble. And yet, Rafaela has done the opposite. He has made more contact, struck out less, and produced like one of the Red Sox's best players. View full article
-
 Pitchers spend a significant portion of their game plans trying to get hitters to expand the strike zone. When they succeed, they usually gain the upper hand. Swings at bad pitches often result in weak contact, whiffs, or strikeouts. Ceddanne Rafaela is becoming an exception to that rule. After hovering around a 37% chase rate during the first two months of the season, Rafaela has taken his aggressiveness to another level in June. His O-Swing% (the rate at which a hitter swings at pitches outside the strike zone) has jumped to an astonishing 60.2%, the highest mark in Major League Baseball so far this month. Boston Red Sox fans won't be too surprised by that fact, but the context makes the number even more remarkable. Ezequiel Tovar ranks second at 56.7%, while Salvador Perez sits third at 54.3%. Rafaela not only leads the leaderboard, but does so by a considerable margin. Hitters With the Highest Chase Rates in June 2026 Player O-Swing% O-Contact% Contact% Ceddanne Rafaela 60.2% 72.6% 80.0% Ezequiel Tovar 56.7% 54.9% 67.3% Salvador Pérez 54.3% 71.9% 79.4% Ernie Clement 53.0% 70.5% 80.9% Kerry Carpenter 51.8% 79.1% 83.9% Michael Harris II 51.0% 69.8% 78.2% Mauricio Dubón 49.6% 81.7% 87.5% Cody Bellinger 49.5% 77.8% 80.4% Ángel Martínez 49.5% 75.6% 78.4% Andrés Giménez 49.4% 72.1% 76.8% The table helps put the number into perspective. Rafaela not only leads MLB in chase rate during June, but also owns one of the strongest contact profiles among this group, an unusual combination for such an aggressive hitter. Normally, a spike of this magnitude in chase rate comes with more whiffs, more strikeouts, and a decline in offensive production. Rafaela, however, has produced the exact opposite outcome. So far in June, he is hitting .333/.348/.533 with an .881 OPS and a 139 wRC+, numbers that have made him one of Boston’s most productive hitters during the month. Although his walk rate has fallen to just 2.2%, he has compensated for it with a combination of contact ability, speed, and production whenever he puts the ball in play. The answer to our paradox lies in how his contact profile has evolved. What stands out is that the increase in aggressiveness has been accompanied by better contact rates. His O-Contact% has climbed to 72.6%, while his Z-Contact% has reached 90.7%, both season highs. The result is an overall contact rate of 80%, enough to prevent the added chasing from turning into a strikeout problem. That helps explain why his strikeout rate sits at just 17.4% in June, below his season average and far removed from the 31.5% mark he posted during his MLB debut in 2023. In fact, Rafaela’s overall development as a hitter has been more substantial than the usual conversations about his plate discipline suggest. His strikeout rate fell from 31.5% in 2023 to 26.4% in 2024, then to 19.9% in 2025, and currently sits at 20.5%. At the same time, his offensive line has improved to .286/.341/.450 this season, good for a career-best 116 wRC+. That progress has come without a dramatic overhaul of his approach. Rafaela remains one of the most aggressive hitters in baseball. The difference is that he is now reducing the cost of that aggressiveness. This chart shows Rafaela’s wOBA production against pitches outside the strike zone during March and April: There was only one clear weakness: pitches located low and inside. Now let's look at the map for June. The weakness against low-and-in pitches has largely disappeared, and more broadly, he has produced across the strike zone in a way few hitters in the league have managed this season. It's a trend worth monitoring as the season unfolds. The underlying metrics suggest that part of his current production may be difficult to sustain. His .299 xwOBA remains well below his actual .348 wOBA, while his expected batting average (.247) also trails his actual mark (.286). In addition, his .343 BABIP sits noticeably above the levels he posted in previous seasons. Even so, the gains in contact ability and strikeout reduction appear genuine. Rafaela no longer relies exclusively on his speed or defense to generate value. He is also showing tangible growth as a hitter without losing his identity at the plate. That is what makes Rafaela such a fascinating player to watch right now. So far in June, he leads Major League Baseball in swings at pitches outside the strike zone, a statistic that would normally signal offensive trouble. And yet, Rafaela has done the opposite. He has made more contact, struck out less, and produced like one of the Red Sox's best players.
 -
Pitchers rarely become better after losing one of the skills that made them successful. For most starters, a steady decline in ground-ball rate is the beginning of a warning sign. Fewer ground balls often lead to more damaging contact, more home runs, and eventually worse results. Yet Ranger Suarez has managed to move in the opposite direction. The defining characteristic of his pitching profile is gradually fading, but the overall package may be more effective than ever. That contradiction lies at the center of Suárez’s first season with the Boston Red Sox. When Boston signed the veteran left-hander, the expectation was straightforward: add a dependable starter capable of stabilizing the rotation. What the Red Sox have received instead is a pitcher who continues to adapt, finding new ways to dominate even as some of the traits that once defined him become less prominent. Through his first 12 starts of 2026, Suárez owns a 3.18 ERA and a 2.94 FIP. Those numbers are impressive on their own, but the path he has taken to reach them is even more fascinating. For years, his identity revolved around his ability to generate ground balls. His sinker anchored the entire approach, forcing hitters to pound the ball into the dirt while limiting damaging contact and keeping home runs under control. That foundation still exists. It simply no longer tells the whole story. Ranger Suárez Is Producing Fewer Ground Balls and Better Results Let's take a quick look at his year-over-year evolution over the past six seasons. Season GB% K/9 HR/9 ERA FIP 2021 59.2% 9.1 0.34 1.36 2.72 2022 55.4% 7.5 0.87 3.65 3.87 2023 48.5% 8.6 0.94 4.18 3.90 2024 51.9% 8.7 0.84 3.46 3.37 2025 46.8% 8.6 0.80 3.20 3.21 2026 36.0% 8.7 0.55 3.18 2.94 The contradiction immediately jumps off the page. His ground-ball rate has fallen to the lowest point of his career as a starter. Under normal circumstances, that trend would raise concerns about sustainability. Instead, his home-run rate has dropped while his ERA has remained remarkably stable, and his FIP has improved to one of the best marks of his career. Taken together, those trends point to something more meaningful than luck or favorable variance. They reveal a pitcher who has successfully evolved his approach without sacrificing effectiveness. Suárez is no longer relying exclusively on contact management. Increasingly, he is preventing quality contact from happening in the first place. A New Path to Dominance Now, let's get a bit more granular and look at the main features of his arsenal. Pitch AVG xBA wOBA xwOBA Whiff% K% Curveball .162 .146 .205 .190 45.5% 52.5% Four-Seam Fastball .188 .246 .250 .341 21.3% 21.6% Sinker .224 .277 .275 .320 17.9% 20.0% The curveball stands out immediately. Opponents are hitting just .162 against it. Its .146 expected batting average and .190 expected weighted on-base average rank among the most dominant pitch-level indicators in baseball. The pitch has long been Suárez's signature weapon, and across his career, no offering in his arsenal has suppressed offensive production more effectively, with opponents posting a wRC+ of just 55 against it. The traditional numbers are impressive enough, but the underlying swing metrics reveal why the pitch has become so effective. Because the story of Suárez's curveball extends beyond strikeouts. At its core, it is a story about deception. The Curveball That Is Reshaping His Profile With the help of some new Baseball Savant data, we can really begin to understand exactly how good this pitch is becoming. Season Whiff% Avg. Miss Distance Flawed Swing% Perfect Contact% 2023 39.0% 4.7" 14% 10% 2024 36.5% 4.1" 16% 12% 2025 25.0% 4.5" 8% 15% 2026 47.5% 4.6" 18% 5% Hitters are missing against Suárez's curveball at the highest rate of the last four seasons. At the same time, they are producing clean contact less frequently than ever before. The perfect-contact rate has fallen to just 5%, while the flawed-swing rate has climbed to its highest level in years. The combination is, to say the least, devastating. When hitters commit, they often miss entirely, and even when they do make contact, the quality of that contact is usually poor. That dynamic helps explain why Suárez continues to thrive despite generating fewer ground balls than at any other point in his career. The shift becomes even more apparent in high-leverage situations. With runners in scoring position, opponents are striking out nearly 30 percent of the time against the southpaw. Those are not the numbers of a traditional pitch-to-contact starter. They belong to a pitcher who can end threats on his own, even without overpowering velocity. Perhaps that is the most compelling takeaway from Suárez's season. The ground-ball specialist who built his reputation in Philadelphia has not disappeared. Instead, he has expanded his identity, pairing his traditional strengths with a level of swing-and-miss ability that has become increasingly important to his success. Ranger Suárez no longer relies solely on weak contact to control games. He now prevents hitters from producing clean swings in the first place, a transformation that helps explain why so many of the underlying metrics support what has been one of the most effective stretches of his career. For a Red Sox team searching for stability in its rotation, that evolution may prove even more valuable than the version of Suárez they originally believed they were acquiring. View full article


